Good morning, everyone, my name is Ted Jacquet, and it’s a pleasure to have the chance to present my senior capstone for Data Science. Currently, I am in my senior year, and I hope to pursue a career in finance/banking where I can utilize the skills learned in Data Science for better problem-solving and solution design for different tasks and problems which may come.
I hope you enjoy learning about my project and feel free to reach out if any questions or concerns.
Email: tojacqu19@earlham.edu
Gitlab: https://gitlab.com/ted.jacquet/ds-capstone/
STOCK TRADING AND INVESTMENT ADVISORY
Abstract
Finding the best investment opportunity can reveal to be a struggle for the amateur investor. With the risk of inflation, market struggles, volatility and macroeconomics concerns, it is quite hard to accurate predict the market. Using machine learning and data ana- lytic techniques we can use historical data, and current information to assess an accurate prediction of a stock performance.
Introduction
There are currently multiple software or platforms that are used for stock trading and investment. They incorporate Machine Learning, Data Science. Since, the beginning of this decade, many trading firms have gone to lay off many of their employees to use tech- nology, as they tend to provide a more accurate prediction of the market, than people – and it is believed that in the future its impact will be even more pronounced.
Thus said, this paper aims to analyze and provide a similar alter- native to stock trading and investment.
The data set(s) you will use and their availability
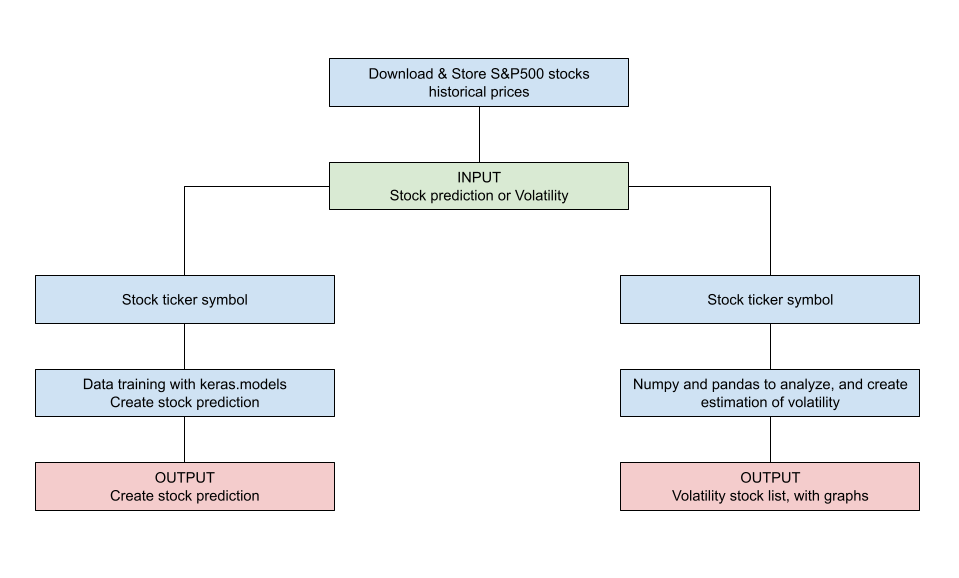
This paper seeks to incorporate a sequential learning model, using “Keras.models” to predict a particular stock price based on that stock’s past performance and other information such as market information, industry information, and geopolitical information. However, for this project’s feasibility, it may take time to accurately predict geopolitical and stock-specific sentiment. Therefore, we have decided to use other software to see if we can accurately get a volume of negative sentiments along with positive ones.
We plan on using several datasets, such as the list of the SP 500 stocks, the stock names, and the stock performance for the last five years from yahoo finance. We also intend to look into google ngram to assess the sentiment vis-a-vis that particular stock. As we work along, there may be other datasets that we might need but insofar as these are pretty available and accessible.
The analysis techniques you will employ We intend to make use of ML to make the prediction. Similarly, we may incorporate
some basic data analysis techniques for long-term trading of a particular stock since it only includes one stock at a time (given by the inputter). However, if the program has to predict which stocks are suitable for short-term trading from the SP500, it might be good to have an ML instead due to the large dataset involved.
The visualizations you will use to communicate your re- sults For visualization, we primarily use tableau to display the search output.
Data Architecture

Results
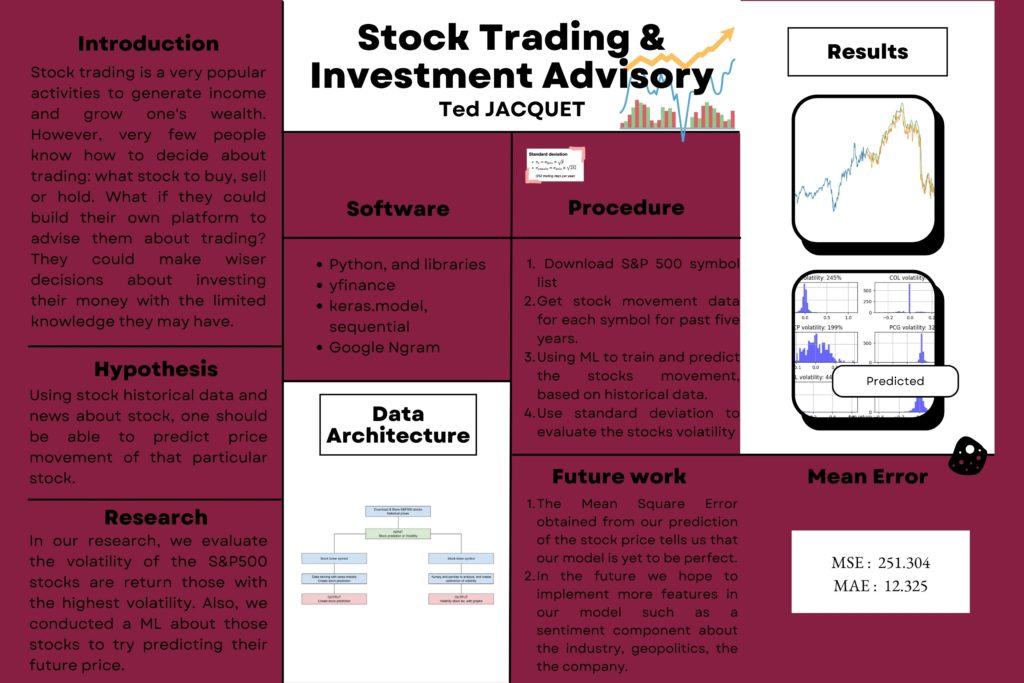
Overall the expected result of our research was revealed to be quite productive. We could predict the most volatile stock accurately since it is formula-based. Similarly, we were able to provide a prediction of the SP500 stocks with our model. However, we did encounter some challenges that made it more difficult than we could expect.
The sequential model we use is straightforward to manipulate with the data. However, some factors we wanted to include in the research were not made possible since Google ngram only provides references from books, not newspapers or digital footprints. That was a drawback.
Despite that, we try finding other platforms, but we are still looking for them. Many of them asked to have a premium account. On top of that, the layout of their website would only make it feasible to download the stock sentiment in the news for some of the companies.
As for the assessment of our predictions so far, we obtained a Mean Squared Error and Mean Absolute Error of 251.30382178491723 and 12.325391259213044, respectively.
Poster
