CS 388
David Barbella
Yujeong Lee
1) Sentiment Analysis on Popular Fiction Books (Data Science)
Research topic/question:
People have long discussed “formulas” for writing successful narrative fiction, such as the three-act structure or the hero’s journey, both models that follow a certain plot formula. I am interested in finding out whether a sentiment progression throughout a fiction book has a relationship to the popularity of the book.
Technology/data:
Python, pandas, Matplotlib. Sentiment analysis. Corpus from Project Gutenbeg.
General approach/method:
To find out whether there is a consistent pattern of sentiment, I will perform a sentiment analysis on each book, either by chapters, by n number of words (e.g. every 1000 words), or by n percentages (e.g. every 10% of the book). I will compare n books of high popularity, n books of medium popularity, and n books of low popularity, to observe whether certain patterns of sentiment correlates to popularity.
Difficulties/potential problems:
It will be difficult to quantify ‘popularity’. If determined by the number of books sold, an ancient book may have significantly more copies sold then a contemporary book of equal popularity. To select a corpus with reduced bias, I will consider limiting selections by a single genre, single author, and/or time (consider only books published between 1800-1900).
One other concern is that this project may yield no correlation.
2) COVID-19 in South Korea (Data Science)
Research topic/question:
Understanding COVID-19 in South Korea by approaching the comprehensive dataset with foundational questions, such as “How is the virus distributed among people of different age?”, “Which regions were most impacted by the virus?”, “Which specific location (certain bar, church) has been central in spreading the virus?”, “What pre-existing conditions have been the most detrimental to COVID patients?”, “Can the future number of cases be predicted through this data?”, “How does search trend relate to the magnitude of reported cases?”.
Technology/data:
Python, pandas, Matplotlib. South Korea COVID-19 dataset (https://www.kaggle.com/kimjihoo/coronavirusdataset)
General approach/method:
Cleaning the data, data visualization.
Difficulties/potential problems:
How can I use more creative methods to approach the data? Would it be possible to provide new insights when so many data analysis has been performed around the world already? Should I use a worldwide dataset, instead of one country?
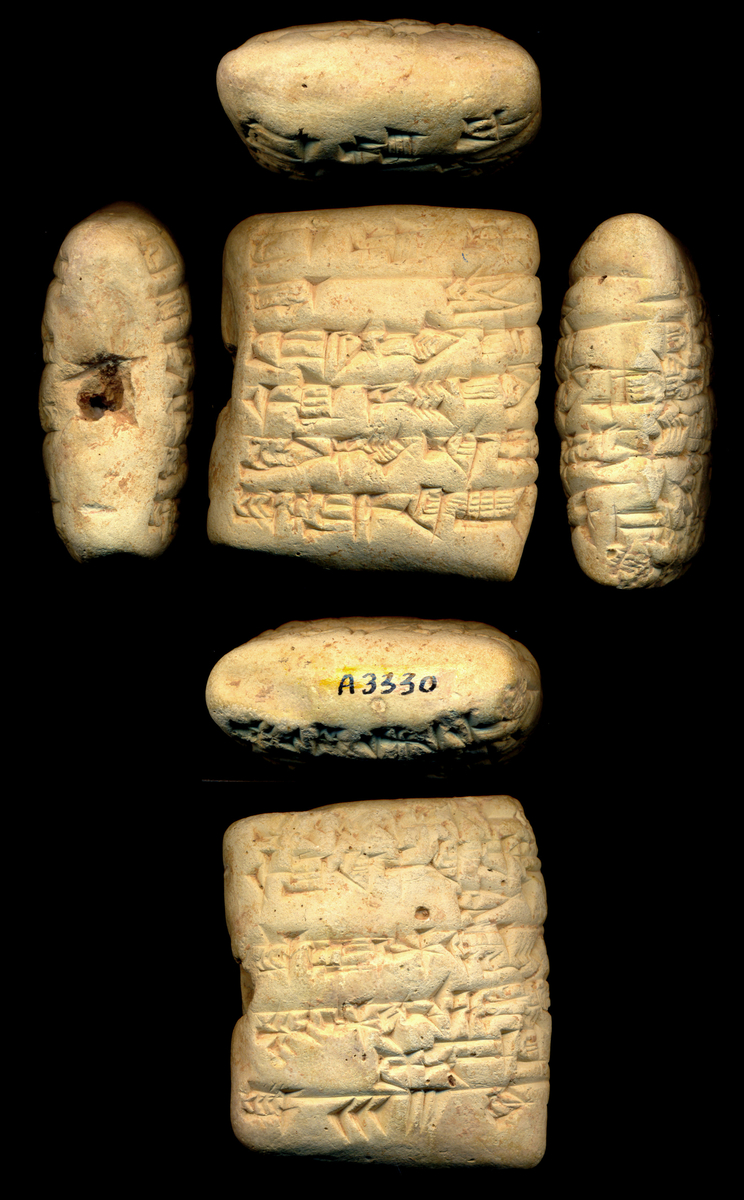
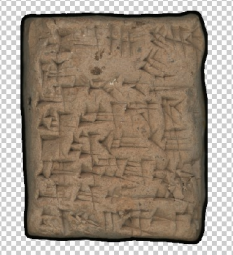
3) Edge Detection for Scanned Images of Cuneiform Tablets (Machine Learning)
Research topic/question:
In collections that preserve ancient Mesopotamian cuneiform tablets, the tablets are digitized and uploaded to the database by scanning each edge of a tablet then combining each image into the shape of a ‘fat cross’, like a rectangular box net. This digitization of thousands of tablets is still done manually in some institutions (which was my internship last summer at the University of Chicago). I am interested in creating a specific edge detection algorithm that, when given a collection of tablet scans, correctly detects the edge of the tablet. Through research and experimentation/implementation, I will decide which edge detection algorithm is the most suitable for tablet scans.
Technology/data:
Python, NumPy, Matplotlib, edge detection methods (e.g. Canny edge detector, Sobel edge detector, Prewitt edge detector, Laplacian edge detector).
Raw images of cuneiform tablet scans (The Oriental Institute at the University of Chicago has made its digital collection available for the public. I can request high definition images for research here).
Difficulties/potential problems:
Evaluation metric: The edge detection method will need an evaluation metric. When processing manually, the standard is to leave a narrow border around the detected edge to prevent abrupt endings that potentially cut off inscriptions at the sides (see images below). I will have to quantify this.
Data: I will reach out to my previous supervisor at UChicago for more images of tablet scans. I can also reach out to a project manager at CDLI for images. However, there is a possibility they may not respond in time for the project.
Further possibilities, beyond this project:
Once I have the edge detection algorithm, I can further the project to completely automate the process of creating a ‘fat cross’ image. I can also create a web interface, which enables the user to dump a large number of tablet scans and retrieve a series of completed ‘fat crosses’.
Leave a Reply
You must be logged in to post a comment.