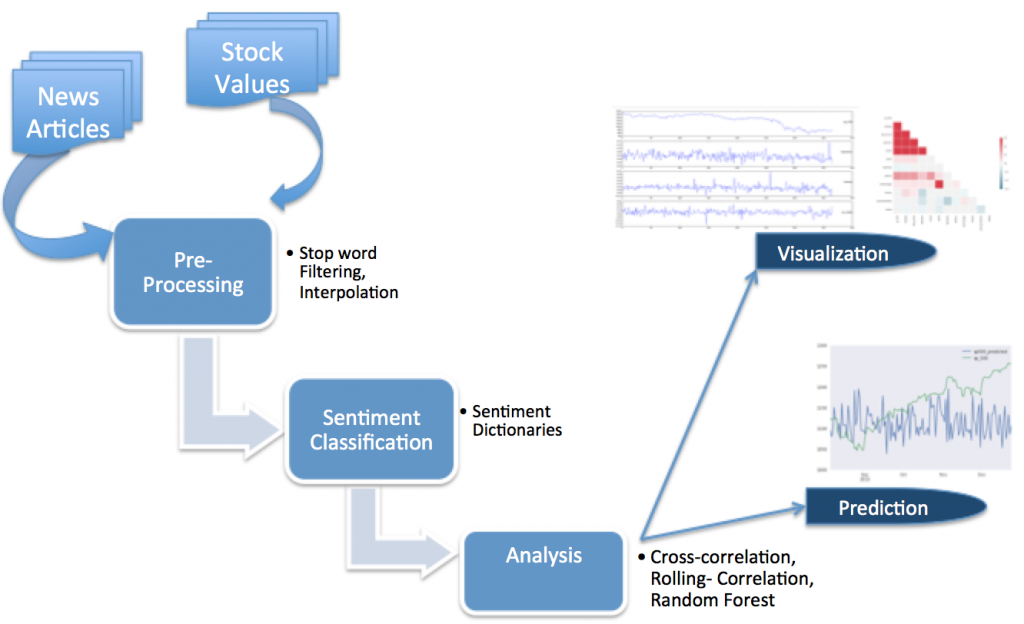
T1- Data Mining, analysis and prediction
Topp, N., & Pawloski, B. (2002). Online Data Collection. Journal of Science Education and Technology, 11(2), 173-178.
This paper touches on the history online data collection, some brief review of the more recent progress and work that is being done as well as how a database connected to the Internet collects data. It also presents a brief insight into where these methods might head towards in the future. Overall, this is a short 7-page article to give a good insight and a starting point as well good references.
Hand, D., Blunt, G., Kelly, M., & Adams, N. (2000). Data Mining for Fun and Profit. Statistical Science, 15(2), 111-126.
This is a more detailed paper regarding the different tool, models, patterns and quality of data mining. Even though it was written in 2000 is very useful is terms of getting a broader idea of model building and pattern detection. It looks at statistical tools and their implementation as well as the challenges to data mining through well explained examples and graphs.
Edelman, B. (2012). Using Internet Data for Economic Research. The Journal of Economic Perspectives, 26(2), 189-206.
Economist have always been keen to collect and analyze data for their research and experimentation. This paper introduces how data scraping has been employed by companies and businesses to extract data for their use. It is an excellent paper that combines data scraping with data analysis and where and how it has been used. It sets the foundation for data analysis and lists various other good papers in the particular field.
Buhrmester, M., Kwang, T., & Gosling, S. (2011). Amazon’s Mechanical Turk: A New Source of Inexpensive, Yet High-Quality, Data? Perspectives on Psychological Science, 6(1), 3-5.
Amazon’s Mechanical Turk helps bring together a statistician’s dream of data collection and an economist’s love for data analysis. It has proved to be an excellent platform to conduct research in not only economics but also psychology and other social sciences. This is a very short 4 page paper that looks at the mechanical Turk, what it has helped research and conclude and how it has been used to obtain high quality inexpensive data. This paper is significant in a sense that it is an application of the above-mentioned tools of collection, analysis and possibly prediction.
T2- A more informed Earlham : Interactive Technology for Social change
1/ Vellido Alcacena, Alfredo et al. “Seeing Is Believing: The Importance of Visualization in Real-World Machine Learning Applications.” N.p., 2011. 219–226. upcommons.upc.edu. Web. 20 Feb. 2017.
2/ “And What Do I Do Now? Using Data Visualization for Social Change.” Center for Artistic Activism. N.p., 23 Jan. 2016. Web. 20 Feb. 2017.
3/ Valkanova, Nina et al. “Reveal-It!: The Impact of a Social Visualization Projection on Public Awareness and Discourse.” Proceedings of the SIGCHI Conference on Human Factors in Computing Systems. New York, NY, USA: ACM, 2013. 3461–3470. ACM Digital Library. Web. 20 Feb. 2017. CHI ’13.
T3– CS for all : Learning made easy.
1/ Muller, Catherine L., and Chris Kidd. “Debugging Geographers: Teaching Programming To Non-Computer Scientists.” Journal Of Geography In Higher Education 38.2 (2014): 175-192. Academic Search Premier. Web. 20 Feb. 2017
2/ Rowe, Glenn, and Gareth Thorburn. “VINCE–An On-Line Tutorial Tool For Teaching Introductory Programming.” British Journal Of Educational Technology 31.4 (2000): 359. Academic Search Premier. Web. 20 Feb. 2017.
3/ Cavus, Nadire. “Assessing The Success Rate Of Students Using A Learning Management System Together With A Collaborative Tool In Web-Based Teaching Of Programming Languages.” Journal Of Educational Computing Research 36.3 (2007): 301-321. Professional Development Collection. Web. 20 Feb. 2017.
