Senior Capstone

with No Comments

Paper

Code

Software overview

Abstract

Writer identification based on handwriting plays an important role in forensic analysis of the documents. Convolutional Neural Networks have been successfully applied to this problem throughout the last decade. Most of the research that has been done in this area has concentrated on extracting local features from handwriting samples and then combining them into global descriptors for writer retrieval. Extracting local features from small patches of handwriting samples is a reasonable choice considering the lack of big training datasets. However, the methods for aggregating local features are not perfect and do not take into account the spatial relationship between small patches of handwriting. This research aims to train a CNN with triplet loss function to extract global feature vectors from images of handwritten text directly, eliminating the intermediate step involving local features. Extracting global features from handwriting samples is not a novel idea, but this approach has never been combined with triplet architecture. A data augmentation method is employed because training a CNN to learn the global descriptors requires a large amount of training data. The model is trained and tested on CVL handwriting dataset, using leave-one-out cross-validation method to test the soft top-N, hard top-N performance.

Software Architecture

Workflow

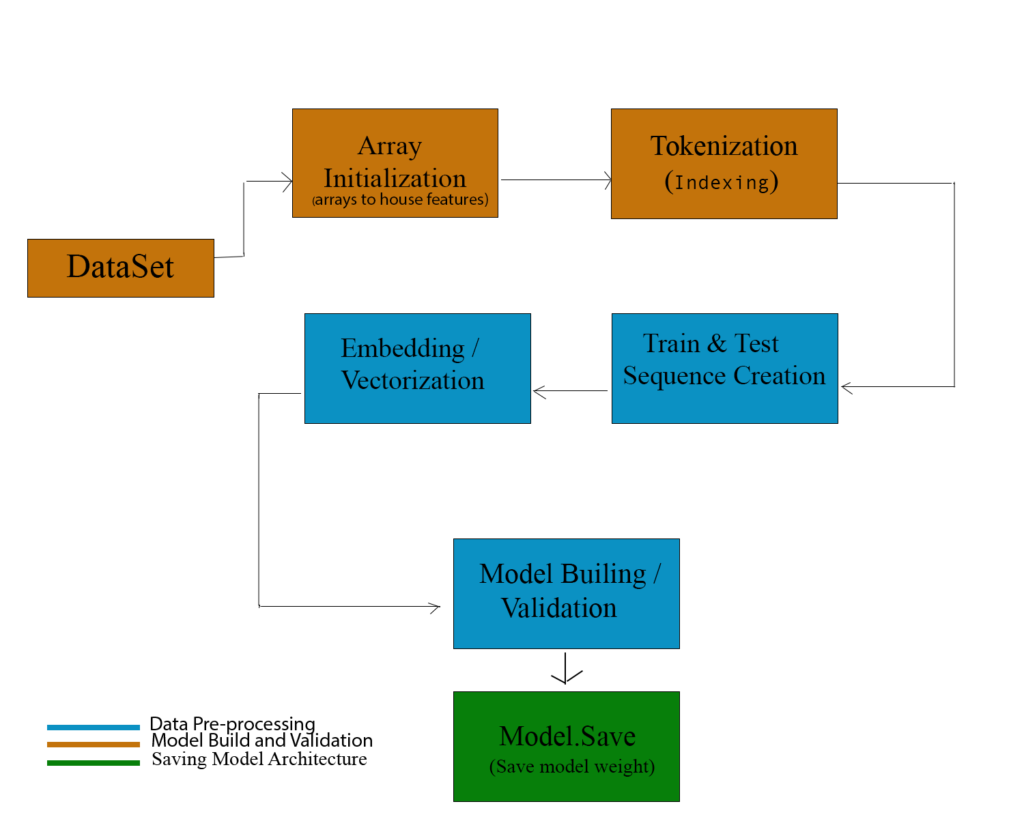
I’m using CVL writer database to train the model. All handwriting samples go through the data augmentation and pre-processing step to standardize the input for CNN. The samples in the training set get augmented, whereas only one page is produced per sample for the test set. The triplets of samples are chosen from each batch to train the CNN. The output of the CNN is a 256D vector. In order to evaluate the model, we build a writer database for samples in the test set.

Data Augmentation

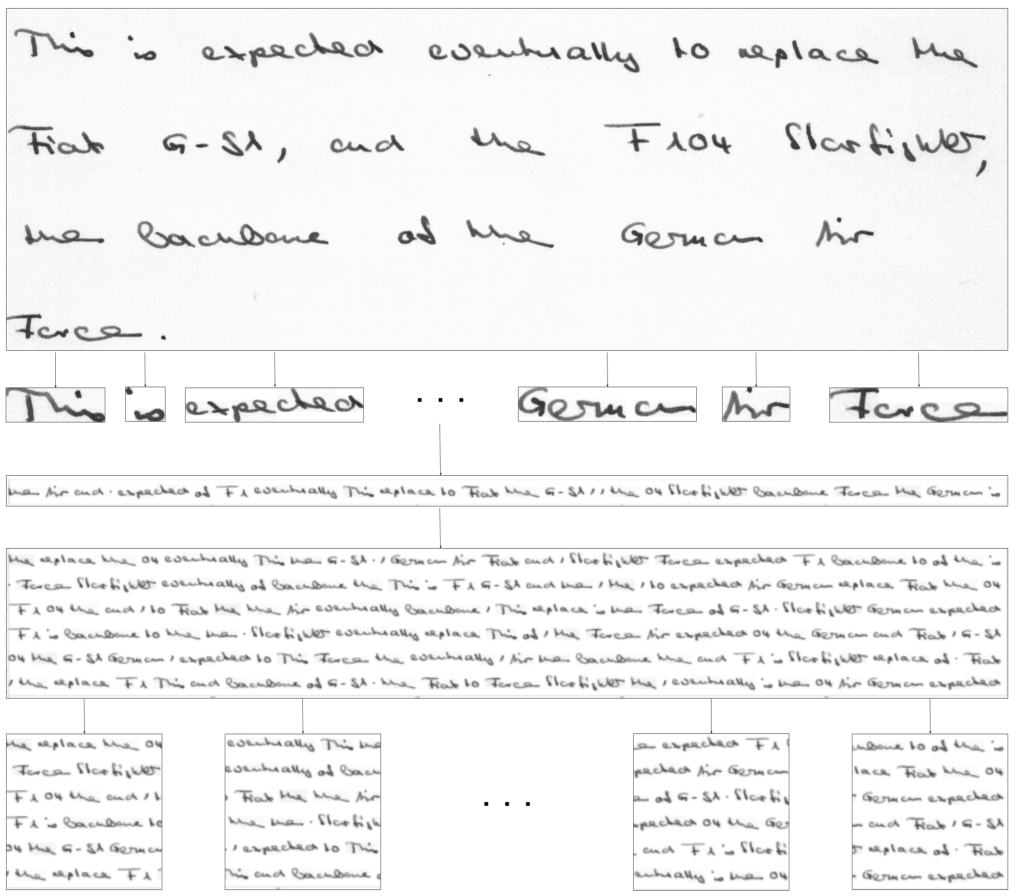
Each handwriting sample goes through the same set of steps:
1. Original handwriting sample.

2. Sample is segmented into words.

3. The words from a single sample are randomly permuted into a line of handwriting. The words are centered vertically.

4. Step 2 is repeated L times to get L lines of handwriting. These lines are concatenated vertically to produce a page.

5. A page is then broken up into non-overlapping square patches. The remainder of the page is discarded. The resulting patches are resized to 224×224 pixels.

6. Steps (4) and (5) are repeated N times.

7. Finally we apply binarization. The patches are thresholded using adaptive Gaussian Thresholding with 37×37 kernel.

CNN framework

The CNN model consists of 3 convolutional blocks followed by a single fully connected layer. Each convolutional block includes a 2D convolutional, batch normalization, max pooling and dropout layers. The final final 256D output vector is normalized. I implemented this CNN framework in keras with tensorflow backend.

The model was trained for 15 epochs with batch gradient descend and Adam optimizer, with an initial learning rate of 3e-4. 10 epochs of training with semi-hard negative triplet mining was followed by 5 epochs of hard negative triplet mining.

Using Online Sentiment to Predict Stock Price Movement

with No Comments

CS488: Senior Capstone Project

-Muskan Uprety

Keywords

Stock Prediction, Sentiment Analysis, Stock Price Direction, Social Media Sentiment

1. Abstract

Due to the current pandemic of the COVID-19, all the current models for investment strategies that were used to predict prices could become obsolete as the market is in a new territory that has not been observed before. It is essential to have some predictive and analytical ability even in times of a global pandemic as smart investments are crucial for securing the savings for people. Due to the recent nature of this crisis, there is limited research in tapping predictive power of market sentiment when a lot of people are deprived from extracurricular activities and thus have turned their focus in capital markets. This research finds that there is evidence of market sentiment influencing stock prices. Adding market sentiment to the classification improved the prediction power of the model as compared to just price and trend information. This shows that sentiment analysis can be used to make investment strategies as it has influence over the price movements in the stock market. This research also finds that looking at the sentiment of posts up to one hour into the past yields the best predictive abilities in price movements

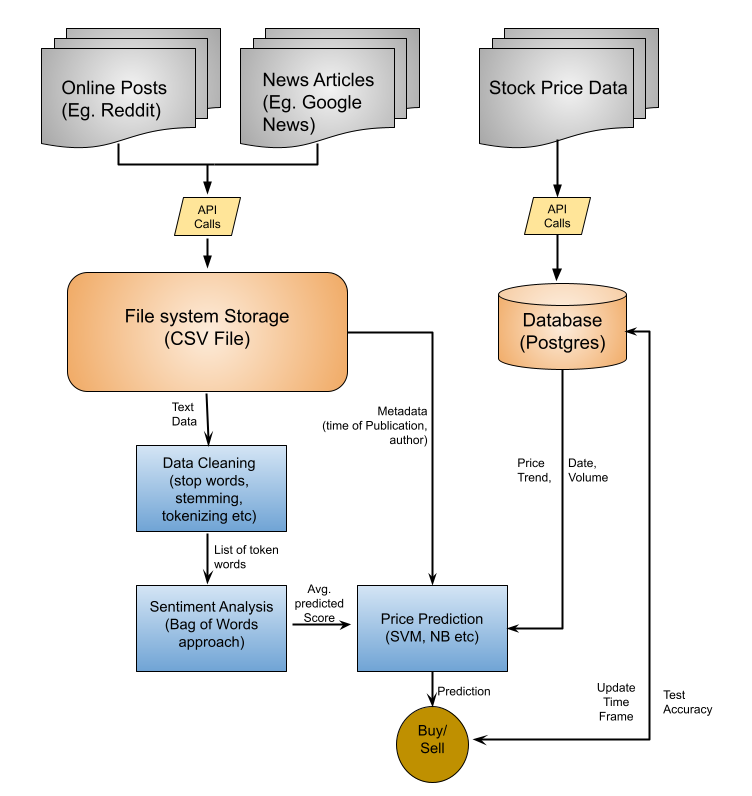
Figure 1. Software Architecture Diagram

Link to Paper: Paper

Link to Source Code: GitLab

Link to Demonstration Video: YouTube

Link to Poster: Poster

Capstone Proposal

with No Comments

Stock Price Prediction using Online Sentiment

Stock Price Prediction using Online Sentiment

Muskan Uprety Department of Computer Science Earlham College Richmond, Indiana, 47374 muprety17@earlham.edu

KEYWORDS

Stock prediction, sentiment analysis, price direction prediction

.

1 ABSTRACT

Due to the current pandemic of the COVID-19, all the current mod- els for investment strategies that were used to predict prices could become obsolete as the market is in a new territory that has not been observed before. It is essential to have some predictive and analytical ability even in times of a global pandemic as smart invest- ments are crucial for securing the existence of savings for people. Due to the recent nature of this crisis, there is limited research in tapping predictive power of various sectors in these unique times. This proposal aims to use texts from online media sources and analyze of these texts hold any predictive powers within them. The proposed research would gather the population sentiment from the online textual data during this pandemic and use the data gathered to train a price prediction model for various stocks. The goal of this research is to check if the prediction model can help make investment strategies that outperforms the market.

2 INTRODUCTION

The unpredictability of stock prices has been a challenge in the Finance industry for as long as stocks have been traded. The goal of beating the market by stockbrokers and experts of the industry have not been materialized, however, the availability of technological resources has certainly opened a lot of doors to experimenting different approaches to try and fully understand the drivers of stock prices. One of the approaches that have been used extensively to try and predict price movements is Sentiment Analysis. The use of this tool is predicated on the fact that stakeholder’s opinion is a major driving force and an indicator for future prices of stock prices. Indicators can be of two types: those derived from textual data (news articles, tweets etc.), and those derived from numerical data (stock prices) [5].

Our research would focus on the textual data derived from sources like Twitter and online news media outlet to analyze if the sentiments in those texts can be used to make price movement predictions in short or long term. It is very important to have some analytical capabilities, specially during and after the COVID-19 pandemic as the outbreak has caused the entire world to be in a shutdown closing businesses indefinitely and burning through peo- ple’s savings. Some panic among consumers and firms has distorted

,,

© 2021

usual consumption patterns and created market anomalies. Global financial markets have also been responsive to the changes and global stock indices have plunged [10].The effect of this disease has created a lot of shifts in the financial industry, along with in- crease in volatility and uncertainty. Due to the pandemic being so recent and ongoing, there is a lack of research on what factors are responsible for the high level of variance and fluctuations in the stock market. While there are papers that analyzes sentiment in text to predict price movements, the applicability of those models in context of a global pandemic is untested. It is vital to be able to have some predictive ability in the stock market as succumbing solely to speculation and fear could result in devastating loss of wealth for individual consumers and investors. The goal of this research is to :

• be able to predict human sentiment from social media posts, • use sentiment to predict changes in price in the stock market • recommend investors to buy, sell, or hold stocks based on

our model
• beat a traditional buy and hold investment strategy.

This paper will first discuss some of the related work that was analyzed in making decisions for algorithms and data to use. After brief discussions about the models to be used in the research, the paper discusses the entire framework of the paper in detail and also discusses the costs associated with conducting this research if any. Finally, the paper proposes a timeline in which the research will be conducted and ends with the references used for this proposal.

3 RELATED WORK

The entire process of using sentiment to predict stock price move- ment is divided into two parts. The first is to to extract the sentiment from the text source using various algorithms, and the second step is to use this information as an input variable to predict the move- ment and direction of the different stocks’ price. various researchers have used different algorithms and models for each of this process. The difference in model is based on the overall goal of the research, the type of text data used for analysis, input parameters used for classifier, and the type of classification problem considered.

3.1 Sentiment analysis

The process of conducting sentiment analysis requires some form of text data that is to be analyzed, and some labels associated with these textual data that allows the model to distinguish if a collection of text is positive or negative in nature. It is quite difficult to find a data set that has been labelled by a human to train the model to make future predictions. Various researchers have used different measures to label their text data in order to train a model to predict

, ,

Muskan Uprety

whether an article or tweet is positive or negative (or neutral but this is not very relevant).

There are a few approaches used by researchers to train their sentiment analysis model. Connor et al. uses a pre-determined bag of words approach to classify their texts [12]. They use a word list which consists of hundreds of words that are determined positive or negative. If any word in the positive word list exists in the text, the text is considered as positive and if any word in the negative word list exists in the text, it is considered negative sentiment. In this approach, an article or tweet can be considered both positive and negative sentiment.

Gelbukh also uses a similar approach of using a bag of words to analyze sentiment [4]. Instead of having pre-determined set of positive and negative word list, they look at the linguistic makeup of sentences like the position of opinion or aspect words in the sentence, part of speech of opinions and aspects and so on to deduce sentiment of the text article.

In the absence of a bag of words for comparison, Antweiler and Frank manually labelled a small subset of tweets into a positive (buy), negative (sell), or neutral (hold classification [1]. Using this as reference, they trained their model to predict the sentiment of each tweet they had into one of these three categories. The researchers also noted that the messages and articles posted in various messaging boards were notably coming from day traders. So although the market price of stocks may reflect the sentiment from entire market participants, the messaging boards most certainly aren’t.

While most researchers looked for either pre-determined bag of words or manually labelled data set, Makrehchi et al automated labelling the text documents [9]. If a company outperforms expec- tations or their stock prices goes higher compared to S&P 500, they assume that the public opinion would be positive and negative if prices go lower than S&P500 or under performs than expectations. Each tweet is turned into a vector of mood words where the column associated with the mood word becomes 1 if the word is mentioned in the tweet and 0 if it isn’t. This way, they train their sentiment analysis model with automated labels for tweets.

3.2 The Prediction Model

All the papers discussed in this proposal use the insights gained from text data collected from various sources. However, the ultimate goal is to check if there is a possibility to predict movement in stock market as a result of such news and tweets online. And researchers use different approaches to make an attempt at finding relationships between online sentiment and stock prices, and they are discussed in this section.

Markechi et. al. collected tweets from people just before and after a major event took place for a company [9]. They used this information to label the tweets as positive or negative. If there was a positive event, the tweets were assumed to be positive and negative if there was a significant negative event. The researchers use this information to train their model to predict the sentiment of future tweets. Aggregating the net sentiment of these predicted tweets, they make a decision on whether to buy, hold, or sell certain stocks. Accounting for weekends and other holidays, they used

Table 1: Papers and Algorithms Used

Papers

Makrehchi et al. [9] Nguyen and Shirai [11] Atkins et al. [2] Axel et al. [6] Gidofalvi [5]

Algorithm Discussed

time stamp analysis TSLDA
LDA
K mean clustering Naive Bayes

this classification model to predict the S&P 500 and were able to outperform the index by 20 percent in a period of 4 months.

Nguyen and Shirai proposed a modified version of Latent Dirich- let Allocation (LDA) model which captures topics and their senti- ments in texts simultaneously [11]. They use this model to assess the sentiments of people over the message boards. They also label each transaction as up or down based on previous date’s price and then use all these features to make prediction on whether the price of the stock in the future will rise or fall. For this classification problem, the researchers use the Support Vector Machine (SVM) classifier which has long been recognized as being able to efficiently handle high dimensional data and has been shown to perform well on many tasks such as text classification [4].

Atkins et. al. used data collected from financial news and used the traditional LDA to extract topic from each news article [2]. Their reasoning of using LDA is that the model effectively reduces features and produces a set of comprehensible topics. Naïve Bayes classifier model follows the LDA model to classify future stock price movements. The uniqueness of this research is that it aims to predict the volatility in prices for stocks instead of trying to predict closing stock prices or simply the movement. They limit their prediction to 60 minutes after an article gets published as the effect of news fades out as time passes.

Axel et. al. collected tweets from financial experts, who they de- fined as people who consistently tweet finance related material, and then used this set of data for their model [6]. After pre-processing the data and reducing dimensions of the data, they experimented with both supervised and unsupervised learning methods to model and classify tweets. They use K mean clustering method to find user clusters with shared tweet content. The researchers then used SVM to classify the tweets to make decisions on buying or selling a stock.

Gidófalvi labelled each transaction as up or down based on pre- vious day pricing [5]. They also labelled articles with the same time frame with similar labels. That is, if a stock price went up, articles that were published immediately before or after also were labelled as up. They then trained the Naïve Bayes text classifier to predict which movement class an article belonged to. Using this predicted article in the test dataset, they predicted the price movement of the corresponding stock. The researchers, through experimentation, found predictive power for the stock price movement in the inter- val starting 20 minutes before and ending 20 minutes after news articles become publicly available.

In terms of classifying text from online media, there was two typed of approaches generally used by researchers. [5] and [9] have used the approach of classifying a text as positive if the text

Stock Price Prediction using Online Sentiment

, ,

was published around a positive event, and classified it as negative sentiment if it was published around the time of some negative event. Their method doesn’t actually look at the contents of the text but rather the time the text was published in. On the other hand, [2] [6] and [11] ,as one would expect, looks inside the text and analyze the contents to classify on whether the authors of these texts intended a positive or negative sentiment. Although algorithms like the LDA or the modified version discussed in [11] are the more intuitive approaches, the fact that classifying texts based on time also yields good results makes me think if reading the text and using computational resources are actually necessary. In the other hand, researchers seem to consistently agree on using SVM as it is widely used in classification problems. Analyzing the various papers, we believe that SVM is the most effective classifier for this stock prediction problem. In the case of sentiment analysis, we believe that more experiments should be done to conduct a cost benefit analysis of actually reading the text for sentiment analysis versus the potential loss of accuracy by just analyzing the time stamp of an article’s publishing.

4 DESIGN
4.1 Framework

Figure 1: Prediction model framework

The framework of this project is shown in Figure 1. The entire project can be divided into two components. The first part is to use the text data collected from various news articles, messaging boards and tweets and create a sentiment analysis model that is able to extract the average sentiment for individual companies. After that, we use the information from this model to train a price prediction classifier which will predict the direction of the stocks prices. Based on this prediction, the overall output will be a recommendation of buy, sell or hold, which we will use to make investment decisions. The recommendation will be made based on predicted price, current price and purchase price. We will analyze the returns of investment strategies suggested my our model, and compare if our profitability would be better than simply investing and holding an index like the S&P 500.

4.2 Data Collection

In order to gather the sentiment from the entire market, we will diversify our sources of textual data. As Antweiler and Frank dis- covered, messaging board comments were heavily skewed towards day traders [1]; we assume the informal setting of Twitter suggests the input of more traditional and individual investors. We also want to include news articles to capture the sentiment of stakeholders that may have been omitted by the other platforms mentioned. In terms of stock prices, we are using Yahoo Finance which is being consistently used by other researchers to capture the stock prices across time. All of this data will be stored in a Postgres database management system

4.3 Capturing Sentiment

For the purpose of categorizing the text documents as positive and negative sentiments, we are going to compare the Rocchio Algo- rithm [13] and the Latent Dirichlect Allocation (LDA) model [3]. These are the two most discussed method and are the algorithms used by researchers to conduct binary classification of textual sen- timent.

After cleaning the data by eliminating non essential text data (filter texts using keywords), we will transform the data into the form needed by the models. Both these algorithms use a bag of word approach where we select a collection of words that are determined to be capturing sentiment in text. For Rocchio algorithm, each text is converted into a vector of words where we keep track of the frequency of words in the text and use this representation of text to predict sentiment. The basic idea of LDA, on the other hand, is that documents are represented as random mixtures over latent topics, where each topic is characterized by a distribution over words [3].

4.4 Price Prediction

Results generated from the Sentiment Analysis model will be used along with a few other input variables from text data to train a classifier which will allow us to make price prediction for individual stocks. For the price prediction model, decision tree [14], support vector machine (SVM) [7] and possibly the Naive Bias models [8] will be tested. We will compare these various models and analyze which model and algorithm produces the best outcome.

5 BUDGET

This project is primarily a python project with some integration of database management system. We intend to use Python pro- gramming, Postgres database management system, Django, and possibly some visualization tool like Tableau. All the computational resources and storage devices are available in Earlham. Since we do not require the purchase of any software, and we anticipate the data to be available online for no cost, there is no cost anticipated at this time.

6 TIMELINE

• week 1-3: finalize the data sources. Research the method/ process to extract data from sources.

• week4-5:ExtractthedatausingappropriateAPIandcreatea database to store the data. Request hardware resources from

, ,

Muskan Uprety

system admins. Have a clear idea of access and updating

database.

  • week 5-6: Start implementing the Sentiment analysis algo- rithm to generate/ predict the sentiment of text data.
  • week 7-8: Test the sentiment analysis model. After confir- mation of the model’s functionality, begin working on the price prediction classifier. Experiment with all the different models for the specific project.
  • week 9-10: Finalize which classifier model is the most accu- rate and is yielding the highest predictability.
  • week 11-12: Compile everything together. Use the final rec- ommendation from the algorithm to make investment deci- sions. Compare the investment decisions coming from the algorithm against the traditional investing and holding a market index like S&P 500.
  • week 13-14: Showcase and present the findings and results. 7 ACKNOWLEDGEMENT I would like to thank Xunfei Jiang for helping draft this proposal, along with the entire Computer Science Department of Earlham for providing feedback on the project idea. REFERENCES
  1. [1]  Werner Antweiler and Murray Z. Frank. 2004. Is all that talk just noise? The information content of Internet stock message boards. Journal of Finance 59, 3 (2004), 1259–1294. https://doi.org/10.1111/j.1540-6261.2004.00662.x
  2. [2]  Adam Atkins, Mahesan Niranjan, and Enrico Gerding. 2018. Financial news predicts stock market volatility better than close price. The Journal of Finance and Data Science 4, 2 (2018), 120–137. https://doi.org/10.1016/j.jfds.2018.02.002
  3. [3]  JoshuaCharlesCampbell,AbramHindle,andEleniStroulia.2015.LatentDirichlet Allocation: Extracting Topics from Software Engineering Data. The Art and Science of Analyzing Software Data 3 (2015), 139–159. https://doi.org/10.1016/ B978- 0- 12- 411519- 4.00006- 9
  4. [4]  Alexander Gelbukh. 2015. Computational Linguistics and Intelligent Text Pro- cessing: 16th International Conference, CICLing 2015 Cairo, Egypt, April 14-20, 2015 Proceedings, Part II. Lecture Notes in Computer Science (including subseries Lecture Notes in Artificial Intelligence and Lecture Notes in Bioinformatics) 9042, August (2015). https://doi.org/10.1007/978-3-319-18117-2
  5. [5]  Gyözö Gidófalvi. 2001. Using news articles to predict stock price move- ments. Department of Computer Science and Engineering University of Cali- fornia San Diego (2001), 9. https://doi.org/10.1111/j.1540-6261.1985.tb05004.x arXiv:arXiv:0704.0773v2
  6. [6]  AxelGroß-Klußmann,StephanKönig,andMarkusEbner.2019.Buzzwordsbuild momentum: Global financial Twitter sentiment and the aggregate stock market. , 171–186 pages. https://doi.org/10.1016/j.eswa.2019.06.027
  7. [7]  Xiaolin Huang, Andreas Maier, Joachim Hornegger, and Johan A.K. Suykens. 2017. Indefinite kernels in least squares support vector machines and principal component analysis. Applied and Computational Harmonic Analysis 43, 1 (2017), 162–172. https://doi.org/10.1016/j.acha.2016.09.001
  8. [8]  EdmondP.F.Lee,EdmondP.F.Lee,JérômeLozeille,PavelSoldán,SophiaE.Daire, John M. Dyke, and Timothy G. Wright. 2001. An ab initio study of RbO, CsO and FrO (X2+; A2) and their cations (X3-; A3). Physical Chemistry Chemical Physics 3, 22 (2001), 4863–4869. https://doi.org/10.1039/b104835j
  9. [9]  MasoudMakrehchi,SameenaShah,andWenhuiLiao.2013.Stockpredictionusing event-based sentiment analysis. Proceedings – 2013 IEEE/WIC/ACM International Conference on Web Intelligence, WI 2013 1 (2013), 337–342. https://doi.org/10. 1109/WI- IAT.2013.48
  10. [10]  Warwick J. McKibbin and Roshen Fernando. 2020. The Global Macroeconomic ImpactsofCOVID-19:SevenScenarios.SSRNElectronicJournal(2020). https: //doi.org/10.2139/ssrn.3547729
  11. [11]  Thien Hai Nguyen and Kiyoaki Shirai. 2015. Topic modeling based sentiment analysis on social media for stock market prediction. ACL-IJCNLP 2015 – 53rd Annual Meeting of the Association for Computational Linguistics and the 7th Inter- national Joint Conference on Natural Language Processing of the Asian Federation of Natural Language Processing, Proceedings of the Conference 1 (2015), 1354–1364. https://doi.org/10.3115/v1/p15- 1131
  12. [12]  BrendanO’Connor,RamnathBalasubramanyan,BryanR.Routledge,andNoahA. Smith. 2010. From tweets to polls: Linking text sentiment to public opinion time

series. ICWSM 2010 – Proceedings of the 4th International AAAI Conference on

Weblogs and Social Media May (2010), 122–129.
[13] J. ROCCHIO. 1971. Relevance feedback in information retrieval. The Smart

Retrieval System-Experiments in Automatic Document Processing (1971), 313–323.

https://ci.nii.ac.jp/naid/10000074359/en/
[14] P.H.SwainandH.Hauska.1977.Thedecisiontreeclassifier:Designandpotential.

IEEE Transactions on Geoscience Electronics 15, 3 (1977), 142–147.

Senior Capstone

with No Comments

Finding correlation between fake news and correspondingsentiment analysis

Abstract

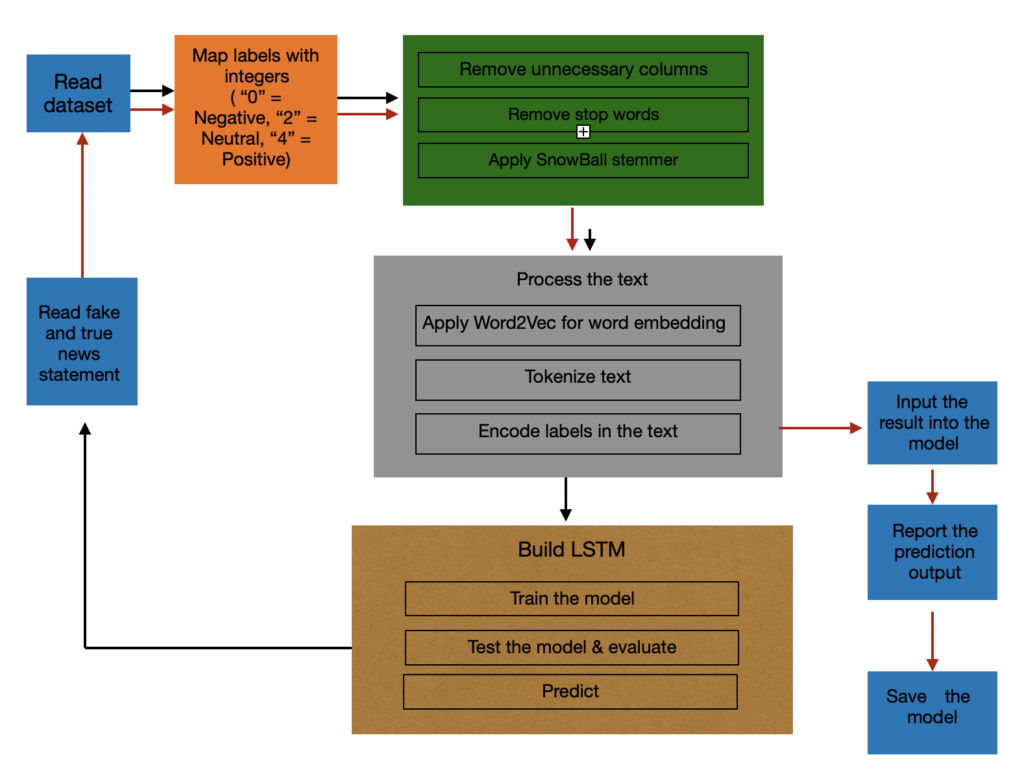
Detection of misinformation has become of great relevance and importance in the past few years. A significant amount of work has been done in the field of fake news detection using natural text processing tools combined with many other filtering algorithms. However, these studies lacked to observe any possible connection that might exist between the tone of the news and the validity of it. In order to research this field and find any existent correlation, my project addresses the potential role that sentiment associated with the news plays in identifying its validity. I perform sentiment analysis on tweets through natural language processing and use neural networks to train the model and test its accuracy.

Final Paper

Final Software Delivery

Final Software Diagram

Senior Capstone – Wildfire Simulation Program

with No Comments

Abstract

With the increase in the number of forest fires worldwide, especially in the West of the United States, there is an urgent need to develop a reliable fire propagation model to aid fire fighting as well as save lives and resources. Wildfire spread simulation is used to predict possible fire behavior, which is essential in assisting fire management and training purposes. This paper proposed an agent-based model that simulates wildfire using a cellular automata approach. The proposed model incorporated a machine learning technique to automatically calculate the igniting probability without the need to manually adjust the input data for a specific location.

Software architecture diagram

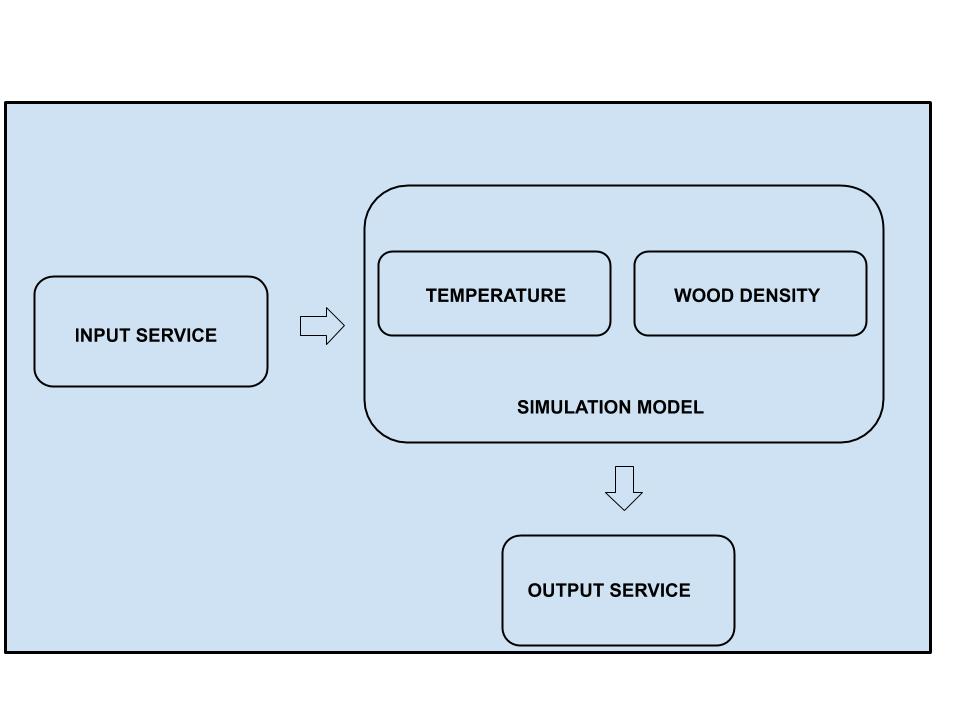
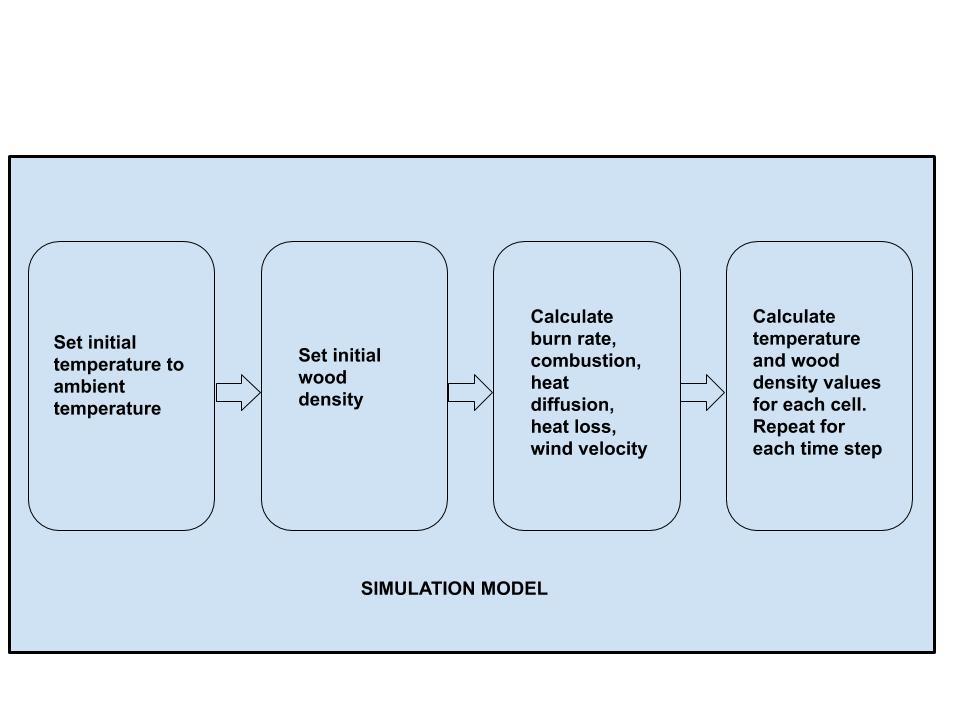
The program includes three large components: the input service, the simulation model, and the output service.

The input service processes users inputs. The input includes diffusion coefficient, ambient temperature, ignition temperature, burn temperature, matrix size, and a wood density data set. All of the inputs can be set to default values if users choose not to provide data. The wood density data set can also be auto-generated if a real-world data set is not provided.

The simulation model is the most important component of the program. This part consists of two main parts, fire temperature simulation service and the wood density simulation service. As the names suggest, the fire temperature simulation service is responsible for processing how fire temperature changes throughout the simulation process. The wood density simulation service is in charge of processing the changes in wood density of the locations described in the input when fire passes through.

The final component, the output service, creates a graph at each time step, and puts together the graphs into a gif file. By using the gif file, users can visualize how fire spreads given the initial inputs.

Design Overview
Simulation ModelThe simulation model

Link to the final version of the paper

https://drive.google.com/file/d/1d4UQhkRWoYSxDWYb5SY-lca6QLaZFJMZ/view?usp=sharing

Link to the final version of the software demonstration video (hosted on YouTube)

https://youtu.be/u7L3QIGLRFg

Senior Capstone

with No Comments

An Integrated Model for Offline Handwritten Chinese Character Recognition Based on Convolutional Neural Networks

Abstract

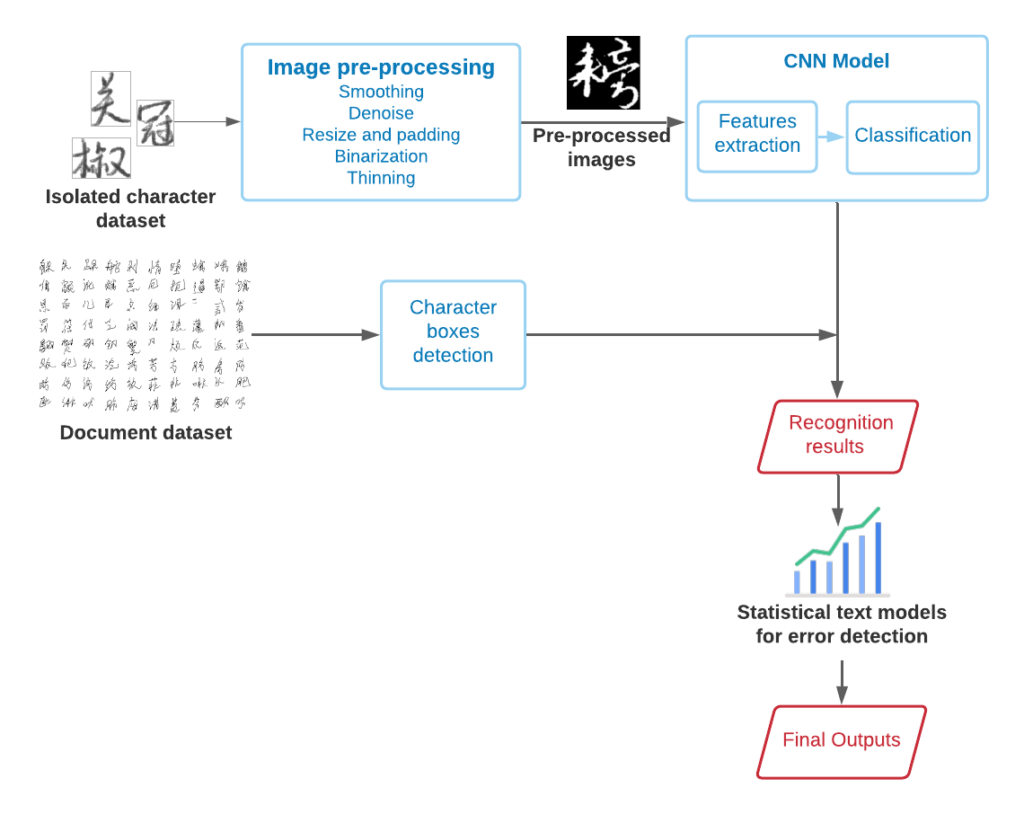
Optical Character Recognition (OCR) is an important technology in computer vision and pattern recognition that recognizes text embedded in images. Although the OCR achieved high accuracy for languages with alphabet-based writing systems, its performance on handwritten Chinese text is poor due to the complexity of the Chinese writing system. In order to improve the accuracy rate, this paper proposes an integrated OCR model for Chinese handwriting that combines existing methods in the pre-processing phase, recognition phase, and post-processing phase.

Paper

Software Demo Video

Software Architecture Diagram

CS488 – Abstract

with No Comments

Optical Character Recognition (OCR) is an important technology in computer vision and pattern recognition that recognizes text embedded in images. Although the OCR achieved high accuracy for languages with alphabet-based writing systems, its performance on handwritten Chinese text is poor due to the complexity of the Chinese writing system. In order to improve the accuracy rate, this paper proposes an integrated OCR model for Chinese handwriting that combines existing methods in the pre-processing phase, recognition phase, and post-processing phase.

Weekly update:

with No Comments

After finish the annotated, I narrowed down to 1 idea to write the literature review. All 3 of my ideas related to machine learning, however I would choose the idea that I feel excited the most and feel motivate the most which is Idea 1: Mask Face Detection.

Covid-19 is a really hot topic right now, and I really hope that I can contribute a little bit in the community health.

Now I am moving on to the literature review.

Weekly update: Annotated Bibliography (18 Annotated)

with No Comments

Idea 1: Masked Face Detection:

Introduction: Due to the fact that the virus that causes COVID-19 is spread mainly from person to person through respiratory droplets produced when an infected person coughs, sneezes, or talks, it is important that people should wear masks in public places. However, it would be difficult to keep track of a large number of people at the same time. Hence, my idea is to utilize machine learning to detect if a person is wearing a mask or not. Hopefully, this idea can help reduce the spread of the coronavirus.

Citation 1: Detecting Masked Faces in the Wild with LLE-CNNs

  • S. Ge, J. Li, Q. Ye and Z. Luo, “Detecting Masked Faces in the Wild with LLE-CNNs,” 2017 IEEE Conference on Computer Vision and Pattern Recognition (CVPR), Honolulu, HI, 2017, pp. 426-434, doi: 10.1109/CVPR.2017.53.
  • Link: https://openaccess.thecvf.com/content_cvpr_2017/papers/Ge_Detecting_Masked_Faces_CVPR_2017_paper.pdf?fbclid=IwAR2UcTzeJsOAI6wPzdlkuMG4NaHMc-b1Gwmf-zl5hD3ueIEfBH-3HOgpMIE
    • Includes the MAFA dataset with 30,811 Internet images and 35,806 masked faces. The dataset can be used for us to train or test our deep learning model.
    • Proposes LLE-CNNs for masked face detection, which we can use as a starting point and as a baseline to reach or beat.
    • To look up: Convolutional Neural Network (CNN)
    • The authors show that on the MAFA dataset, the proposed approach remarkably outperforms 6 state-of-the-arts by at least 15.6%.
    • Check if the authors have published codes to reproduce all the experiment results.

The paper introduces a new dataset for masked face detection as well as a model named LLE-CNNs that the authors claimed to have outperformed 6 state-of-the-arts by at least 15.6%. Fortunately, the dataset is publicly available and is exactly what we are looking for for the problem that we are proposing. 

Citation 2: FDDB: A Benchmark for Face Detection in Unconstrained Settings

The link Github contains the MAFA dataset that has the images of people divided into three main factors: face with mask, face without mask, face without mask but getting blocked by phone, hand, people. This dataset exactly fits with the goal of the research.

Citation 3: Object-oriented Image Classification of Individual Trees Using Erdas Imagine Objective: Case Study of Wanjohi Area, Lake Naivasha Basin, Kenya

  • Chepkochei, Lucy Chepkosgei. “OBJECT-ORIENTED IMAGE CLASSIFICATION OF INDIVIDUAL TREES USING ERDAS IMAGINE OBJECTIVE: CASE STUDY OF WANJOHI AREA, LAKE NAIVASHA BASIN, KENYA.” (2011).
  • Link: https://pdfs.semanticscholar.org/67b5/21baf2b8828e13b7fd73ab0108d2cbfa6f8c.pdf
    • The author provide a method named Object-Oriented Image Classification and Image Objective tool which would help us understand more about the method we are going to use for the research 

Although this research target is focusing all about object classification, however it brings up a good background when it comes to image classification. 

Citation 4: Joint Face Detection and Alignment using Multi-task Cascaded Convolution Network

  • K. Zhang, Z. Zhang, Z. Li and Y. Qiao, “Joint Face Detection and Alignment Using Multitask Cascaded Convolutional Networks,” in IEEE Signal Processing Letters, vol. 23, no. 10, pp. 1499-1503, Oct. 2016, doi: 10.1109/LSP.2016.2603342.
  • Link: https://ieeexplore.ieee.org/abstract/document/7553523
    • The author of this paper proposed a cascaded based framework CNNs that multi-task heping in detection face and alignment.
    • Showing the model they have come out with real time performance for 640×480 VGA imagine with 20×20 minimum face size 
    • Contain three main important stages to predict face and landmark location a coarse-to-fine manner as designed cascaded CNNs architecture, online hard sample mining strategy and join face alignment learning 

This paper provides a model to help detect people’s face and alignment in difficult environments due to various poses, illuminations and occlusions. Throughout this paper we can have a bigger picture about what face detection is, what is the difference and how this method can help in detecting a person’s face

Citation 5: RefintFace: Refinement Neural Network for High Performance Face Detection

  • S. Zhang, C. Chi, Z. Lei and S. Z. Li, “RefineFace: Refinement Neural Network for High Performance Face Detection,” in IEEE Transactions on Pattern Analysis and Machine Intelligence, doi: 10.1109/TPAMI.2020.2997456.
  • Link: https://arxiv.org/pdf/1909.04376.pdf
    • The authors proposed a face detector named RefineFace that can detect faces in extreme poses or have small size in the background.
    • Extensive experiments conducted on WIDER FACE, AFW, PASCAL Face, FDDB, MAFA demonstrate that our method achieves state-of-the-art results and runs at 37.3 FPS with ResNet-18 for VGA-resolution images.

The paper provides a model that can detect faces with extreme poses or possess small sizes. This can be helpful to us since the first step of our problem is to detect faces.

Citation 6: Very Deep Convolutional Neural Networks for Large-Scale Image Recognition

  • Simonyan, Karen & Zisserman, Andrew. (2014). Very Deep Convolutional Networks for Large-Scale Image Recognition. arXiv 1409.1556. 
  • Link: https://arxiv.org/pdf/1409.1556.pdf
    • The authors proposed a Convolutional Neural Network architecture, which was state-of-the-art for the Large Scale Visual Recognition Challenge 2014 (ILSVRC2014).

The architecture can be used for our problem as well if we train the model on our own training set and training loss.

Idea 2: Speaker Recognition:


Introduction: BookTubeSpeech is a newly released dataset for speech analysis problems. The dataset contains 8,450 YouTube videos (7.74 min per video on average) that each contains a single unique speaker. Not much work on speaker recognition has been done using this dataset. My work is to provide one of the first baselines on this dataset for speaker recognition / speaker verification.

Citation 1: Deep Speaker: an End-to-End Neural Speaker Embedding System

  • Li, Chao & Ma, Xiaokong & Jiang, Bing & Li, Xiangang & Zhang, Xuewei & Liu, Xiao & Cao, Ying & Kannan, Ajay & Zhu, Zhenyao. (2017). Deep Speaker: an End-to-End Neural Speaker Embedding System.
  • https://arxiv.org/pdf/1705.02304.pdf
    • The author proposes Deep Speaker, a neural embedding system that maps utterances of speakers to a hypersphere where speaker similarity is measured by cosine similarity.
    • To look up: i-vector paper, equal error rate (EER)
    • Through experiments on three distinct datasets, the authors show that Deep Speaker are able to outperform a DNN-based i-vector baseline. They claim that Deep Speaker reduces the verification EER by 50% relatively and improves the identification accuracy by 60% relatively.
    • Make sure that the datasets that the authors used are publicly available.
    • Fortunately, the authors do publish their codes so we can train and test on the BookTubeSpeech dataset.

The paper presents a novel end-to-end speaker embedding model named Deep Speaker. Although the paper is not new, it is definitely something we can use for our problem since the authors do publish their codes, which are readable and runnable.

Citation 2: Voxceleb: Large-scale speaker verification in the wild

  • Nagrani, Arsha & Chung, Joon Son & Xie, Weidi & Zisserman, Andrew. (2019). VoxCeleb: Large-scale Speaker Verification in the Wild. Computer Speech & Language. 60. 101027. 10.1016/j.csl.2019.101027. 
  • Link: https://www.robots.ox.ac.uk/~vgg/publications/2019/Nagrani19/nagrani19.pdf
    • The author introduce a data set named VoxCeleb which contain 600 speakers over a million real world utterances 
    • Propose a pipeline based on computer vision techniques to create dataset from open-source media including Youtube 
    • A CNN architecture and CNN based facial recognition with methods and training loss functions that even under different conditions still can identify  the speaker’s voices

This research contains a various dataset with a CNN architecture and CNN based facial recognition method used to identify the speaker voice. These methods would be beneficial for the research since BookTubeSpeech also a type of data set from Youtube, which also contains imagination and voice. Also this method might help in solving different cases such as the voices of the speaker getting affected by some others sound such as sound, other human voices. 

Citation 3: X-Vectors: Robust DNN Embeddings For Speaker Recognition

  • D. Snyder, D. Garcia-Romero, G. Sell, D. Povey and S. Khudanpur, “X-Vectors: Robust DNN Embeddings for Speaker Recognition,” 2018 IEEE International Conference on Acoustics, Speech and Signal Processing (ICASSP), Calgary, AB, 2018, pp. 5329-5333, doi: 10.1109/ICASSP.2018.8461375.
  • Link: https://www.danielpovey.com/files/2018_icassp_xvectors.pdf
    • The author proposed a speaker recognition system using Deep Neural Network.
    • X-vector is considered state-of-the-art for speaker recognition even up to now.
    • The paper also proposed using PLDA on top of the x-vector embeddings to increase discriminality.

The authors of the paper propose a DNN-based speaker embedding model that is currently state-of-the-art for speaker recognition and speaker verification problems. Hence, it goes without saying that we should use this as one of our models to report results on the BookTubeSpeech dataset.

Citation 4: Generalized End-to-End Loss for Speaker Verification

  • L. Wan, Q. Wang, A. Papir and I. L. Moreno, “Generalized End-to-End Loss for Speaker Verification,” 2018 IEEE International Conference on Acoustics, Speech and Signal Processing (ICASSP), Calgary, AB, 2018, pp. 4879-4883, doi: 10.1109/ICASSP.2018.8462665.
  • Link: https://arxiv.org/abs/1710.10467
    • The authors proposed a new loss function called GE2E that does not require an initial stage of example selection.
    • The new loss function makes the model faster to train while still able to achieve competitive performance.

The paper proposes a new loss function that the authors claim to yield competitive performance but fast to train.

Citation 5: Toward Better Speaker Embeddings: Automated Collection of Speech Samples From Unknown Distinct Speakers

  • M. Pham, Z. Li and J. Whitehill, “Toward Better Speaker Embeddings: Automated Collection of Speech Samples From Unknown Distinct Speakers,” ICASSP 2020 – 2020 IEEE International Conference on Acoustics, Speech and Signal Processing (ICASSP), Barcelona, Spain, 2020, pp. 7089-7093, doi: 10.1109/ICASSP40776.2020.9053258.
  • Link: https://users.wpi.edu/~jrwhitehill/PhamLiWhitehill_ICASSP2020.pdf 
    • The paper proposes a pipeline for automatic data collection to train speaker embedding models. Using the pipeline the authors also managed to collect a dataset named BookTubeSpeech containing speech audios from 8,450 speakers.
    • The dataset contains mostly clean speech, i.e. no background noises.

The paper proposes a pipeline for large-scale data collection to train speaker embedding models. They also contributed a dataset named BookTubeSpeech that we are mainly going to use for our experiments.

Citation 6: Probabilistic Linear Discriminant Analysis

  • Ioffe S. (2006) Probabilistic Linear Discriminant Analysis. In: Leonardis A., Bischof H., Pinz A. (eds) Computer Vision – ECCV 2006. ECCV 2006. Lecture Notes in Computer Science, vol 3954. Springer, Berlin, Heidelberg. https://doi.org/10.1007/11744085_41
  • Link: https://link.springer.com/content/pdf/10.1007%2F11744085_41.pdf 
    • PLDA is often used on top of output of speaker embeddings model to increase speaker discrimilaity.
    • Normally, paper related to speaker recognition or speaker verification report results both with or without PLDA.

The author proposes Probabilistic LDA, a generative probability model with which we can both extract the features and combine them for recognition. We can use PLDA on top of our models’ outputs to gain an increase in performance.

Idea 3: Sport players prediction result using machine learning:


Introduction:How many yards will an NFL player gain after receiving a handoff?” I will be attending a competition on Kaggle. During the process, Kaggle would provide a dataset of players from different teams, the team, plays, players’ stats including position and speed to analyze and generalize a model of how far an NFL player can run after receiving the ball.  

Citation 1: A machine learning framework for sport result prediction

  • Bunker, Rory & Thabtah, Fadi. (2017). A Machine Learning Framework for Sport Result Prediction. Applied Computing and Informatics. 15. 10.1016/j.aci.2017.09.005. 
  • Link: https://www.sciencedirect.com/science/article/pii/S2210832717301485
    • Even though the paper is about sport result prediction not player performance prediction, it does provide good insights on how to tackle our problem. In particular, the authors provide a framework that we can apply to our problem. 
    • Moreover, each step of the framework is clearly explained with detailed examples. The framework can be used for both traditional ML models as well as for artificial neural networks (ANN).

The paper provides not only a critical survey of the literature on Machine Learning for sport result prediction but also a framework that we can apply to our problem. While the survey can help us get a sense of which method works best, the framework will let us know what to do next after we have picked our model.

Citation 2: Scikit-learn: Machine Learning in Python

  • Pedregosa, Fabian, Gaël Varoquaux, Alexandre Gramfort, Vincent Michel, Bertrand Thirion, Olivier Grisel, Mathieu Blondel, et al. “Scikit-Learn: Machine Learning in Python.” arXiv.org, June 5, 2018.
  • Link: https://arxiv.org/abs/1201.0490
    • The author introduced a good framework to train traditional Machine Learning models as well as artificial neural networks.
    • The library is in Python, which is one of the languages that I am most familiar with.

Citation 3: Using machine learning to predict sport scores — a Rugby World Cup example

Although this is not an official research, however it contains the step-by-step to do research related to this topic detailly. It also listed all of the tools that are necessary and fit with the topic of the research. 

Citation 4: Long Short-Term Memory

  • Hochreiter, Sepp, and Jürgen Schmidhuber. “Long short-term memory.” Neural computation 9.8 (1997): 1735-1780.
  • Link: http://citeseerx.ist.psu.edu/viewdoc/download?doi=10.1.1.676.4320&rep=rep1&type=pdf
    • The authors introduced the Long Short-Term Memory, which is a model that can handle sequence data. 
    • We can definitely expect sequence data in sports data. For example, the number of touchdowns in a season of a NFL player.

For our problem, we will definitely try different deep learning architectures. LSTM is one of the architectures that we are going to try.

Citation 5: XGBoost: A Scalable Tree Boosting System

Not every problem requires deep learning models, we should try traditional Machine Learning techniques as well. Hence, we should try XGBoost.

Citation 6: Principal component analysis

  • Abdi, Hervé, and Lynne J. Williams. “Principal component analysis.” Wiley interdisciplinary reviews: computational statistics 2.4 (2010): 433-459.
  • Link: https://onlinelibrary.wiley.com/doi/abs/10.1002/wics.101
    • Principal Component Analysis (PCA) is among the most effective dimensionality reduction algorithms. 
    • When faced with a large set of correlated variables, principal components allow us to summarize this set with a smaller number of representative variables that explain most of the variability in the original set.

The PCA features can also be used as new features that we can feed into our machine learning models.

Weekly update: Annotated Bibliography (First versions)

with No Comments

Idea 1: Masked Face Detection:

Citation 1: Detecting Masked Faces in the Wild with LLE-CNNs

  • S. Ge, J. Li, Q. Ye and Z. Luo, “Detecting Masked Faces in the Wild with LLE-CNNs,” 2017 IEEE Conference on Computer Vision and Pattern Recognition (CVPR), Honolulu, HI, 2017, pp. 426-434, doi: 10.1109/CVPR.2017.53.
  • Link: https://openaccess.thecvf.com/content_cvpr_2017/papers/Ge_Detecting_Masked_Faces_CVPR_2017_paper.pdf?fbclid=IwAR2UcTzeJsOAI6wPzdlkuMG4NaHMc-b1Gwmf-zl5hD3ueIEfBH-3HOgpMIE
    • Includes the MAFA dataset with 30,811 Internet images and 35,806 masked faces. The dataset can be used for us to train or test our deep learning model.
    • Proposes LLE-CNNs for masked face detection, which we can use as a starting point and as a baseline to reach or beat.
    • To look up: Convolutional Neural Network (CNN)
    • The authors show that on the MAFA dataset, the proposed approach remarkably outperforms 6 state-of-the-arts by at least 15.6%.
    • Check if the authors have published codes to reproduce all the experiment results.

The paper introduces a new dataset for masked face detection as well as a model named LLE-CNNs that the authors claimed to have outperformed 6 state-of-the-arts by at least 15.6%. Fortunately, the dataset is publicly available and is exactly what we are looking for for the problem that we are proposing. 

Idea 2: Speaker Recognition:

Citation 1: Deep Speaker: an End-to-End Neural Speaker Embedding System

  • Li, Chao & Ma, Xiaokong & Jiang, Bing & Li, Xiangang & Zhang, Xuewei & Liu, Xiao & Cao, Ying & Kannan, Ajay & Zhu, Zhenyao. (2017). Deep Speaker: an End-to-End Neural Speaker Embedding System.
  • https://arxiv.org/pdf/1705.02304.pdf
    • The author proposes Deep Speaker, a neural embedding system that maps utterances of speakers to a hypersphere where speaker similarity is measured by cosine similarity.
    • To look up: i-vector paper, equal error rate (EER)
    • Through experiments on three distinct datasets, the authors show that Deep Speaker are able to outperform a DNN-based i-vector baseline. They claim that Deep Speaker reduces the verification EER by 50% relatively and improves the identification accuracy by 60% relatively.
    • Make sure that the datasets that the authors used are publicly available.
    • Fortunately, the authors do publish their codes so we can train and test on the BookTubeSpeech dataset.

The paper presents a novel end-to-end speaker embedding model named Deep Speaker. Although the paper is not new, it is definitely something we can use for our problem since the authors do publish their codes, which are readable and runnable.

Citation 2: FDDB: A Benchmark for Face Detection in Unconstrained Settings

The link Github contains the MAFA dataset that has the images of people divided into three main factors: face with mask, face without mask, face without mask but getting blocked by phone, hand, people. This dataset exactly fits with the goal of the research.

Idea 3: Sport players prediction result using machine learning:  

Citation 1: A machine learning framework for sport result prediction

  • Bunker, Rory & Thabtah, Fadi. (2017). A Machine Learning Framework for Sport Result Prediction. Applied Computing and Informatics. 15. 10.1016/j.aci.2017.09.005. 
  • Link: https://www.sciencedirect.com/science/article/pii/S2210832717301485
    • Even though the paper is about sport result prediction not player performance prediction, it does provide good insights on how to tackle our problem. In particular, the authors provide a framework that we can apply to our problem. 
    • Moreover, each step of the framework is clearly explained with detailed examples. The framework can be used for both traditional ML models as well as for artificial neural networks (ANN).

The paper provides not only a critical survey of the literature on Machine Learning for sport result prediction but also a framework that we can apply to our problem. While the survey can help us get a sense of which method works best, the framework will let us know what to do next after we have picked our model.

We need to uploaded and finish 18 annotated, however this is my way to write annotated bibliography. I am still trying to finish 18 annotated as soon as I can.

CS388-Annotated Bibliography – Eliza Vardanyan

with No Comments

Artificial Neural Networks in Image Processing for Early Detection of Breast Cancer

MEHDY, M. M., P. Y. NG,  E. F. SHAIR, N. I. SALEH, CHANDIMA GOMES.2017. Artificial neural networks in image processing for early detection of breast cancer. Computational and mathematical methods in medicine.

The paper examines four different approaches to breast cancer in medicine ( MRI, IR< Mammography and ultrasound). For the classification, the paper looks at three different techniques: Support Vector Machine, Method based on rule ( decision tree and rough sets), Artificial Neural Network. The paper also divided the types of data that need to be classified: calcification and non calcification, benign and malignant, dense and normal breast, tumorous and non tumorous. The paper addressed different types of Neural networks that exist and have been used in related works in Breast Cancer Detection : Feed-forward backpropagation, Convolution Neural Networks.

NOTES:

  • The paper looks/reviews into four different applications of medical imaging: MRI, IR, mammography and ultrasound for the cause of identifying breast cancer early
  • It addresses the use of hybrid Neural Networks in breast cancer detection
  • Investigates artificial neural networks  in the processing of images
  • Reviews three types of classification decisions for image feature selection and focuses on one (ANN- artificial neural network):Support Vector Machine, method based on rule ( decision tree and rough sets), artificial neural network
  • Subtle appearances and ambiguous margins are the obstacles for differentiating abnormalities if present in breast cancer using mammogram
  • Artificial Neural network is used in CAD(computer-aided diagnosis) allowing to overcome difficulties of image processing by radiologists. ANN has two applications in CAD: direct application of classifier at the image data region of interest (ROI) and using preprocessed image signals analyzing the extracted features of an image
  • Look into Dhawan et al.: used 3-layer neural network and backpropagation algorithm for image structure feature identification
  • Image processing includes various techniques and one of them is the image segmentation. It detects small, local and bright spots on a raw image. 
  • Image segmentation reaches high accuracy by relying on a set of labeled test images( true positives(TP), false positives(FP)).
  • The technique used in this paper for pattern classification is called on cascade correlation (CC) 
  • Look into: Sinin and Vijai – Grey-Level Co Occurrence Matrix(GLCM)
  • Ultrasound – creating three-dimensional ultrasound imaging giving in debt information on breast lesion 
  • MRI imaging  – recommended way of soft tissue recognition. 
  • The types of data that is needed to classify in this paper is of these types: calcification and non calcification, benign and malignant, dense and normal breast, tumorous and non tumorous. 

Breast Cancer detection using deep convolutional neural networks and support vector machines

RAGAB, DINA A., MAHA SHARKAS, STEPHEN MARSHALL, JINCHANG REN.2019.Breast cancer detection using deep convolutional neural networks and support vector machines. PeerJ ,7(e6201).

This paper, for breast cancer detection, is using CAD (Computer Aided Detection) classifier to differentiate benign and malignant mass tumors in breast mammography.  It touches upon two techniques used in CAD – manual determination of the region of interest and technique of threshold based on the region. For the feature extract, the paper is using DCNN (Deep Convolutional Neural Network), allowing accuracy of 71.01%. Look up AlexNet for more reference and background on DCNN. Another classifier that the paper explores includes  Support Vector Machine(which appears to be very useful in fake news detection as well and is very common in cancer detection techniques). This paper, in contrast to other papers in this field, focuses on getting a better image segmentation by increasing the contrast, suppressing noise to reach higher accuracy of breast cancer detection.  Look up other image enhancement techniques that are referenced in this paper (E.g. Adaptive COntrast Enhancement, Contrast-limited Adaptive Histogram Equalization). 

NOTES:

  • Uses CAD (computer aided detection system to classify benign and malignant mass tumors in breast mammography images
  • As the other , this paper as well touches upon the two techniques of CAD system – manual determination of the region of interest while the second approach is different: technique of threshold and region based
  • The types of neural network that this paper is looking at is DCNN – deep convolutional neural network to extract features.
  • Look AlexNet for DCNN 
  • Touches upon support vector machine (SVM) classifier for higher accuracy
  • Using datasets: (1) the digital database for screening mammography (DDSM); and (2) the Curated Breast Imaging Subset of DDSM (CBIS-DDSM)
  • Uses data augmentation to get bigger input data taht is based on the original data – uses rotation type of data augmentation
  • The accuracy of this approach DCNN is 71.01%
  • The process of CAD systems consists of  steps: image enhancement, image segmentation, feature extraction, feature classification, evaluation for the classifier
  • This paper, in contrast to the one previously mentioned, touches upon getting a better image for segmentation – it enhances images by increasing the contrast, suppressing noise for a better and accurate breast cancer determination
  • Look these image enhancement techniques: adaptive contrast enhancement, contrast -limited adaptive histogram equalization – type of an AHE used to improve the contrast in images
  • There are few methods for image segmentation that the author review: edge, fuzzy theory, partial differential equation, artificial neural network, threshold and region-based segmentation
Detection of breast cancer on digital histopathology images: Present status and future possibilities

ASWATHY, M. A., M. JAGANNATH. 2017.Detection of breast cancer on digital histopathology images: Present status and future possibilities. Informatics in Medicine Unlocked, 8 : 74-79.

For the breast cancer detection idea, this paper references Spanhol et al. as the source of the data (over 7000 images) used in the training of the algorithm. The steps of the image processing from histopathology are: preprocessing of the images, then segmentation, extraction of the feature and classification. The paper is reviewing convolutional neural networks as an image processing method. Compared to the previous paper, this paper is focusing on the importance of biopsy methods of cancer detection as well as reviews other methods that are common in cancer detection. For future development, the paper is suggesting to explore spectral imaging as well as create more powerful tools to achieve higher image resolution.

Notes: 

Look up: Spanhol et al. for the data – used over 7000 images

The steps involved in the algorithm for histopathology image processing include preprocessing of the images, then segmentation, extraction of the feature and classification.

The paper is observing the convolution neural network as an architecture for image analysis

This paper, compared to the previous one, is mainly focusing on the importance of biopsy in cancer detection, as well as reviews other methods that have been used in the sphere of cancer detection. 

The paper has also suggestions for the future possibilities such as exploring spectral imaging. Another issue that the article mentions that can be solved is the creation of more powerful tools for the image resolution for digital pathology 

Prediction Crime Using Spatial Features

BAPPEE, FATEHA KHANAM, AMILCAR SOARES JUNIOR, STAN MATWIN. 2018.Predicting crime using spatial features.In Canadian Conference on Artificial Intelligence,367-373. Springer, Cham.

This paper approaches crime detection from the perspective of geospatial features and shortest distance to a hotpoint.  The end product of this paper is the creation of OSM (Open Street Map). The search of crime hotspots and spatial distance feature is done with the help of hierarchical density-based spatial clustering of Application with Noise (HDBSCAN). For crime patterns of alcohol-related crime the paper references Bromley and Nelson. Some other related works are also using KDE (Kernel Density Estimation) for hospoint prediction. The crime data is categorized into four groups: alcohol-related, assault, property damage and motor vehicle . The type of classifiers that the paper is using are: Logistic Regression, Support Vector Machine (SVM), and Random FOrest . Future improvement is suggested in the sphere of data discrimination.

NOTES:

  • Focuses on crime prediction based on geospatial features from a crime data and shortest distance to a hotpoint
  • The data is used to create OSM( open street map)
  • Using hierarchical density-based spatial clustering of Application with Noise (HDBSCAN) to find crime hotspots and spatial distance feature is retrieved from these hotspots
  • Look up Bromley and Nelson into crime patterns of alcohol-related crime
  • Kernel Density Estimation (KDE) is used in other related works for hotspot prediction
  • Some other related work used KDE with the combination of other features ( Temporal features) for crime hotspot analysis.
  • The paper groups the crime into four different classes: alcohol-related, assault, property damage and motor vehicle 
  • The paper uses Logistic Regression, Support Vector Machine (SVM), and Random FOrest as classifiers
  • Paper discusses the issues of possible data discrimination – as a future work to be improved

Big Data Analytics and Mining for Effective visualization and Trends forecasting of crime data

FENG, MINGCHEN, JIANGBIN ZHENG, JINCHANG REN, AMIR HUSSAIN, XIUXIU LIM YUE XI, AND QIAOYUAN LIU.. 2019. Big data analytics and mining for effective visualization and trends forecasting of crime data. IEEE Access, 7: 106111-106123.

This paper is implementing data mining with the help of various algorithms:  Prophet model, Keras stateful LSTM, neural network models. After using these models for prediction, the results are compared. For further data mining algorithms and application, we can look up Wu et al. and Vineeth et al. as these were references in the paper. Three datasets were used from three different cities: San-Francisco, Chicago and Philadelphia. The data from the following countries included the following features: Incident number, dates, category, description, day of the week, Police department District ID, Resolution, address, location ( longitude and latitude), coordinates, weather the crime id was domestic or not, and weather there was an arrest or no. For data visualization, Interactive Google Map was used in this paper. Market cluster algorithm was used with the aim of managing multiple markets for spatial scales and resolution. 

NOTES:

  • The paper reviews various algorithms for data mining : Prophet model, Keras stateful LSTM, – neural network models
  • Look up Wu et al. and Vineeth et al. for data mining algorithms and application
  • Uses three crime datasets from 3 cities:San-francisco, Chicago and Philadephia
  • The data included the following features: Incident number, dates, category, description, day of the week, Police department Distrcit ID, Resolution, address, location ( longitude adn latitude), coordinates, weather the crime id was domestic or not, and weather there was an arrest or no
  • Interactive Google map was used for data visualization
  • Marker cluster algorithm was used to manage multiple markets for spatial scales adn resolution
  • Prediction models used: prophet model, Neural network model and LSTM model and compares the results 

Crime prediction using decision tree classification algorithm

IVAN NIYONZIMA, EMMANUEL AHISHAKIYE, ELISHA OPIYO OMULO, AND DANISON TAREMWA.2017. Crime Prediction Using Decision Tree (J48) Classification Algorithm.

This paper approaches crime detection with decision tree and data mining algorithms. This paper, compared to the previous one, gives context on predictability of crimes. The algorithms used in classification  that the paper references to are: Decision Tree Classifier, Multilayered Perception (MLP), Naive Bayes Classifiers, Support Vector Machines (SVM). For the system specification, design and implementation a spiral model was used. The training dataset was taken from UCI Machine Learning Repository. For the training purposes Waikato Environment for Knowledge analysis Tool Kit was used. 

NOTES:

-uses decision tree and data mining

– Touches upon the context behind the predictability of crimes 

– uses classification algorithm – Decision Tree Classifier (DT),Multilayered Perception (MLP) , Naive Bayes Classifiers, Support Vector Machines, 

The paper performs analysis on these algorithms based on their performance on crime prediction 

-Spiral Model was used to specify the system, design it and implement it 

– the dataset was taken from UCI machine learning repository 

Waikato Environment for Knowledge analysis Tool Kit was used for the training of crime dataset

Beyond News Contents: the role of Social Context for Fake News Detection 

SHU, KAI, SUHANG WANG, AND HUAN LIU.2019. Beyond news contents: The role of social context for fake news detection. In Proceedings of the Twelfth ACM International Conference on Web Search and Data Mining, 312-320.

This paper proposes a tri-relationship framework for fake news detection that analyzes publisher-news relations as well as user-news interactions. The algorithm behind news content embedding is based on nonnegative matrix factorization that projects the news-word matrix to the semantics factor. The evaluation of reported performance is the average of three training processes of TriFN (tri-relationship framework) performances. This paper, in addition, also checks if there is an existing relationship between the delay time of the news and detection of fake news. It also analyzes the importance of social engagement on the performance of fake news detection.

NOTES: 

  • Proposes Tri-relationship framerfork (TriFN) – for publisher-news relations modeling and user-news interactions 
  • Uses nonnegative matrix factorization algorithm for projecting news-word matrix to the semantics factor space ( NEWS CONTENTS EMBEDDING)
  • Evaluates the performance of TriFn by generating the training process three times and the average performance is reported.
  • The paper also checks what’s the correlation between the delay time and detection performance  – social engagement as a helping factor for fake news detection
  • Related works : references to previous work that has been done in linguistic -based and visual-based 

Fake News Detection on Social Media Using Geometric Deep Learning

MONTI, FEDERICO, FABRIZIO FRASCA, DAVIDE EYNARD, DAMON MANNION, AND MICHAEL M. BRONSTEIN. 2019. Fake news detection on social media using geometric deep learning.arXiv preprint arXiv:1902.06673.

This paper uses geometric deep learning for fake news detection on social media. The paper hsa a main focus of data extraction adn testing on Twitter platform. The paper discusses convolution neural networks as a classification method. This paper questions the correlation between the time of the news’ spread and the level of performance of the implemented detection method. The paper also mentions the use of non-profit organizations in the process of data collection, specifically the following journalist fact-checking organizations: Snopes, PolitiFact and Buzzfeed. It is also important to look up pioneering work of Vosoughi et al., as that work is referenced in this paper of great importance in data collection in the fake news detection sphere. All of the features that news were classified into were four: User profile, User activity, network and spreading, and content. It is important to note that this paper mentions that the advantage of deep learning is that it can learn task-specific features given data. 

NOTES: 

  • Uses geometric deep learning for fake news detection
  • Like some of my other ideas and the papers that were discussing the classification methods, here as well it touches upon convolutional neural networks
  • The paper is discussing and using the model to train and test stories and data from and on Twitter
  • This paper, like the one before, also analysis the correlation between the time of the news’ spread and the accuracy and performance of the fake news detection 
  • Uses Snopes, PolitiFact and Buzzfeed non-profit organizations for journalist fact-checking
  • Data collection was based on the pioneering work of Vosoughi et al. 
  • Human annotators were employed 
  • Following categories were made out of all the features: user profile , user activity, network and spreading and content.
  • Deep learning, compared to other methods, has the advantage to learn task-specific features given the data.

FAKEDETECTOR: Effective Fake News Detection with Deep Diffusive Neural Network

ZHANG, JIAWEI, BOWEN DONG, S. YU PHILIP. 2020. Fakedetector: Effective fake news detection with deep diffusive neural networks. In 2020 IEEE 36th International Conference on Data Engineering (ICDE), 1826-1829.

This paper focuses on a novel model for fake detection – Deep Diffusive Model called GDU that can simultaneously accept multiple inputs from various sources. The paper compares deep diffusive network’s performance with already existing other methods. As a baseline for the fact checking, the paper is using PolitiFact – seems to be a common and reliable source for fact checking. The two main components of deep diffusive network models are: representation feature learning and credibility label inference. For related works need to check Rubin et al. that focuses on unique features of fake news, as well as Singh et al. that focuses on text analysis. In addition Tacchini et al. proposes various classification methods for fake news detection 

NOTES:

  • Uses deep diffusive network model (GDU) )for training – accepts multiple inputs from different sources at the same time
  • Compared FAKE DETECTOR algorithm with deep diffusive network model with already existent other models
  • Used data includes tweets posted by POlitiFact
  • This is using a similar for fact checking baseline as the paper we mentioned earlier
  • Deep diffusive network model consists of two main components: representation feature learning and credibility label inference
  • Deep diffusive networks use output state vectors of news articles, news creators and news subjects for the learning process.
  • For related works need to check Rubin et al. that focuses on unique features of fake news, as well as Singh et al. that focuses on text analysis. In addition Tacchini et al. proposes various classification methods for fake news detection 

“Liar, Liar Pants on Fire”: A New Benchmark Dataset for Fake News Detection

WANG, WILLIAM YANG, 2017. Liar, liar pants on fire: A new benchmark dataset for fake news detection. arXiv preprint arXiv:1705.00648.

This paper uses a dataset of 12.8K that was manually labeled from PolitiFact.com. The dataset is used as a benchmark for fake checking. This paper is focusing on surface-level linguistic patterns for fake news detection purposes. For this it uses a hybrid convolutional neural network for metadata integration.  This paper has a different approach to the fake news detection problem: its viewing the news from a 6-way multiclass text classification frame and combines meta-data with text to get a better fake news detection.

NOTES: 

  • Uses 12.8K manually labeled short statements in differentes contexts from PolitiFact.com
  • Uses this dataset for fact checking 
  • Surface-level linguistic patterns are the focus of the fake detection 
  • Uses hybrid convolutional neural network for metadata integration purposes
  • Look up: Ott et al., 2011; Perez- Rosas and Mihalcea, 2015 for datasets
  • Approaches the problem of fake detection through 6-way multiclass text classification frame
  • Lookup Kim, 2014 for CNN models
  • Combines meta-data with text and get Better fake news detection

EANN: Event Adversarial Neural Networks for Multi-Modal Fake News Detection

WANG, YAQING, FENGLONG MA, ZHIWEI JIN, YE YUAN,GUANGXU XUN, KINSHLAY JHA, LU SU, JING GAO.2018. Eann: Event adversarial neural networks for multi-modal fake news detection. In Proceedings of the 24th acm sigkdd international conference on knowledge discovery & data mining, 849-857.

This paper is the basis of a fake news detection algorithm in three component-consisted Event Adversarial Neural Network framework: multi-modal feature extractor, fake news detector and event discriminator. For textual feature extraction, the paper is using convolutional neural networks (CNN), while for  twitter dataset content evaluation, the paper is using MediaEval Verifying Multimedia. The paper also eliminates those tweets that do not have media attached to the tweets. To detect fake news, the paper is also using Weibo Dataset. 

NOTES: Derives event invariant features (extractor) ~ 

  • Uses three components to build the Event Adversarial Neural Network framework: multi-modal feature extractor, fake news detector and event discriminator
  • CNN (convolutional neural network) is the core of the textual feature extractor
  • The paper is using MediaEval Verifying Multimedia Use benchmark for twitter dataset content evaluation; the dataset is used for both training and testing
  • This paper focuses on Tweets that have attached media 
  • For fake news detection Weibo dataset is used; news is being collected from authoritative news sources and debunked by Weibo. 

Fake News Detection via NLP is Vulnerable to Adversarial Attacks

 ZHIXUAN ZHOU,HUANKANG GUAN, MEGHANA MOORTHY BHAT, JUSTIN HSU.2019. Fake news detection via NLP is vulnerable to adversarial attacks. arXiv preprint arXiv:1901.09657.

This paper approaches the fake news detection from the linguist classification point of view and targets the weakness of this method. The paper uses Fakebox for experimenting reasons. It uses McIntire’s Fake-real-news-dataset  which is open source. The paper focuses on the text content of these dataset (which are in, approximately, 1:1 proportion label fake and real). The paper also brings up a possible solution to the weakness of the linguist classification of datasets: adoption in conjunction with linguistic characteristics.

NOTES: Paper approaches to the issues if linguistic classification of news 

  • Uses Fakebox as a fake news detector for experimenting
  • Suggests a different approach to fake news detection: adoption in conjunction with linguistic characteristics
  • Uses McIntire’s Fake-real-news-dataset  which is open source
  • The paper focuses on the text content of these dataset (which are in, approximately, 1:1 proportion label fake and real0
  • Fakebox, the algorithm discussed in this paper, focuses on the following features of the text/news: title/headline (checks for clickbait), content, domain
  • Look up Rubin et al. : separates fake news by their type – serious fabrications, large-scale hoaxes and humorous fakes

Breast Cancer detection using image processing techniques

CAHOON, TOBIAS CHRISTIAN, MELANIE A. SUTTON, JAMES C. BEZDEK.2000. Breast cancer detection using image processing techniques.In Ninth IEEE International Conference on Fuzzy Systems. FUZZ-IEEE 2000 (Cat. No. 00CH37063), vol. 2, 973-976.

This paper uses K-nearest neighbor classification method for cancer detection. This paper focuses on image processing from the Mammography screenings taken from Digital Database for Screening Mammography.  To get better accuracy in image segmentation, the paper adds window means and standard deviation. This paper, when compared to related work in this field, does not review further related methods and techniques used in related works and does not compare results with other authors’ results. 

NOTES: The paper uses k-nearest neighbor classification technique 

  • Database of images is from the Digital Database for Screening Mammography
  • Uses fuzzy c-means method – unsupervised method
  • Adds window means and standard deviation to get better image segmentation final product
  • The paper, compared to the other related work, does not go as deep to related works, to comparing other methods tried by other authors

Detection of Breast Cancer using MRI: A Pictorial Essay of the Image Processing Techniques

JAGLAN, POONAM, RAJESHWAR DASS, MANOJ DUHAN. 2019.Detection of breast cancer using MRI: a pictorial essay of the image processing techniques. Int J Comput Eng Res Trends (IJCERT) 6, no. 1, 238-245.

This paper is unique with its discussion of the weaknesses of MRI images. Those are: poor image quality, contrast and blurriness. The paper reviews techniques of enhancing image quality. The paper compared various image enhancement filters(Median filter, Average filter, Wiener Filter, Gaussian filter) and compared the results of noise reduction and image quality. The paper uses various statistical parameters for the final performance evaluation: PSNR(Peak signal to noise ratio), Mean Square Error (MSE), Root MEan Square Error (RMSE), MEan Absolute Error (MAE). The paper also reviews the most common noises present in MRI images: Acoustic Noise and Visual NOise

NOTES: touches upon weaknesses of MRi images – suffer poor quality of image, contrast, blurry 

  • Touches upon ways of enhancing images –  compares various image enhancement filters: Median filter, Average filter, Wiener Filter, Gaussian filter and compares the results of noise reduction and image quality
  • The paper uses various statistical parameters for the final performance evaluation: PSNR(Peak signal to noise ratio), Mean Square Error( MSE), Root MEan Square Error ( RMSE), MEan Absolute Error (MAE). 
  • The paper also reviews the most common noises present in MRI images: Acoustic Noise and Visual NOise
Role of image thermography in early breast cancer detection- Past, present and future

DEEPIKA SINGH, ASHUTOSH KUMAR SINGH.  2020. Role of image thermography in early breast cancer detection-Past, present and future. Computer methods and programs in biomedicine 183. 105074.

The paper presents a survey that took into consideration the following cancer detection systems:Image acquisition protocols, segmentation techniques, feature extraction and classification methods. This paper highlights the importance of thermography in breast cancer detection as well as the need to improve the performance of thermographic techniques. The databases used in this paper are: PROENG (from University Hospital at the UFPE), Biotechnology-Tripura University-Jadavpur University database. The paper reviews the role of quality of image segmentation in the reduction of false positive and false negative values in thermography.

NOTES: 

  • presentation of a survey that took into consideration the following detection systems: Image acquisition protocols, segmentation techniques, feature extraction and classification methods
  • Highlights the importance of thermography in breast cancer detection
  • The paper highlights the need to improve the performance of thermographic techniques
  • The databases of the images used are: PROENG (from University Hospital at the UFPE), Biotechnology-Tripura University-Jadavpur University database
  • Reviews the role of image segmentation in the reduction of false positive and false negative values in thermography 

DeepCrime: Attentive Hierarchical Recurrent Networks for Crime Prediction

HUANG CHAO, JUNBO ZHANG, YU ZHENG, NITESH V. CHAWLA. 2018. DeepCrime: attentive hierarchical recurrent networks for crime prediction. In Proceedings of the 27th ACM International Conference on Information and Knowledge Management, 1423-1432.

This paper uses deep neural network architecture as a classification method. The paper uses DeepCrime algorithm to find the relevance between the time period and crime occurrence. It addresses the main technical challenges when working on crime prediction:  temporal Dynamics of crime patterns, complex category dependencies, Inherent interrelations with Ubiquitous data, and unknown temporal relevance. The paper uses the New York City Open Data portal for the crime dataset. Related works view crime detection in different methods. For example, Wang et al. uses the points of interest information for the crime prediction while Zgao et al. approaches crime prediction from the spatial-temporal correlation point of view. 

NOTES: Uses deep neural network architecture

  • DeepCrime can find relevance between the time period and crime occurrence
  • Addresses the main technical challenged when working on crime prediction: temporal Dynamics of crime patterns, complex category dependencies, Inherent interrelations with Ubiquitous data, unknown temporal relevance,
  • Uses New York City Open Data portal for the crime dataset
  • Related work: look up Lian et al. – “studies restaurant survival prediction based on geographical information, user mobilities” ; Wang et al. related taxi trajectories work
  • Something to consider is how to get hotspots – Wang et al uses the points of interest information for the crime prediction purposes while Yu et al.’s approach was based on boosting-based clustering algorithm
  • Gerber et al. look up – used Twitter data to predict crimes, while Zhao et al. approaches crime prediction from the spatial-temporal correlation point of view

 Predicting Incidents of Crime through LSTM Neural Networks in Smart City

ULISES M. RAMIREZ-ALCOCER, EDGAR TELLO-LEAL, JONATHAN A. MATA-TORRES. 2019. Predicting Incidents of Crime through LSTM Neural Networks in Smart City. in The Eighth International Conference on Smart Cities, Systems, Devices and Technologies.

This paper uses a long short-term memory neural network for the prediction algorithms. This neural network allows the network to choose among the data which ones to remember and which ones to forget. The process of these methods follows these steps: data pre-processing, categorization and construction of the predictive model. The neural network of this method consists of three layers: input layer, hidden layer and output layer. This paper also references toe Catlet et al. and highlights the correlation of the future crime rate to the previous week’s trend set. For the further spatial analysis and auto-regressive models the paper references Catlet et al. 

NOTES: Uses Long Short-term memory neural network for the prediction algorithms

  • This neural network allows the network to choose among the data which ones to remember and which ones to forget
  • The process of this methods follows these steps: data pre-processing, categorization and construction of the predictive model 
  • The neural network is design of three layers – input, hidden and output layers
  • Look up Catlett et al. for spatial analysis and auto-regressive models – will be useful for high-risk crime region detection
  • The paper also reference to the Catlett et al. and the correlation of the future crime rate and the previous week’s trend set

Deep Convolutional Neural Networks for Spatiotemporal Crime Prediction 

LIAN DUAN, TAO HU, EN CHENG, JIANFENG ZHUM CHAO GAO. 2017. Deep convolutional neural networks for spatiotemporal crime prediction. In Proceedings of the International Conference on Information and Knowledge Engineering (IKE), 61-67. 

Tihs paper proposes a Spatiotemporal Crime Network using convolutional Neural Network. The paper uses New York City (2010 -2015) datasets. The paper compares the following models: Rolling Weight average, Support Vector Machines, Random Forests, Shallow fully connected neural networks. The paper uses TensorFlow1.01 and CUDA8.0 with the aim of building STCN and SFCNN. A limitation of this paper is that it does not take into account various data types for better prediction performance, accuracy. 

NOTES:

  • Proposes a Spatiotemporal Crime Network – uses convolutional Neural networks 
  • Uses New York City (2010-2015) datasets
  • Compares the proposed method with four other models: Rolling Weight average, Support Vector Machines, Random Forests, Shallow fully connected neural networks
  • Uses TensorFlow1.01 and CUDA8.0 with the aim of building STCN and SFCNN
  • Limitation of this paper is that it does not take into account various data types for better prediction performance, accuracy
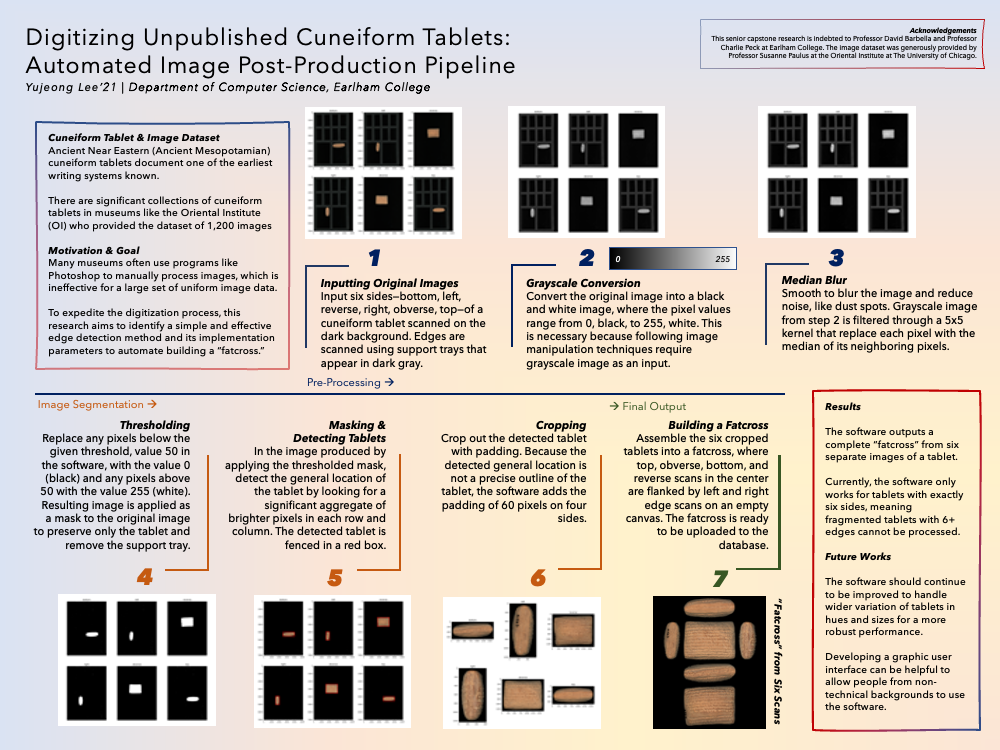
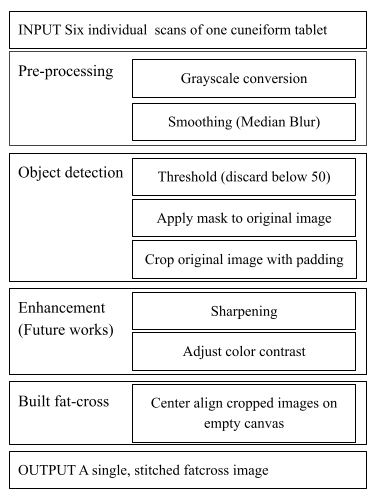
Pitch ideas

with No Comments

Idea 1: Masked Face Detection:
Introduction: Due to the fact that the virus that causes COVID-19 is spread mainly from person to person through respiratory droplets produced when an infected person coughs, sneezes, or talks, it is important that people should wear masks in public places. However, it would be difficult to keep track of a large number of people at the same time. Hence, my idea is to utilize machine learning to detect if a person is wearing a mask or not. Hopefully, this idea can help reduce the spread of the coronavirus.

Idea 2: Speaker Recognition:
Introduction: BookTubeSpeech is a newly released dataset for speech analysis problems. The dataset contains 8,450 YouTube videos (7.74 min per video on average) that each contains a single unique speaker. Not much work on speaker recognition has been done using this dataset. My work is to provide one of the first baselines on this dataset for speaker recognition / speaker verification.

Idea 3: Sport players prediction result using machine learning
Introduction: “How many yards will an NFL player gain after receiving a handoff?” I will be attending a competition on Kaggle. During the process, Kaggle would provide a dataset of players from different teams, the team, plays, players’ stats including position and speed to analyze and generalize a model of how far an NFL player can run after receiving the ball.  

CS388- Final pitches – Eliza Vardanyan

with No Comments

1. Fake news/unreliable source detection

Fake news detection algorithm would be an improved version of detecting unreliable sources. For this, I would need to come up with a database of credible data and identify the trustworthiness of the source based on that database. 

Combination of multiple features will be required to identify to then evaluate the unreliability of the news/source. Some of those features are word combination, attached images, clickbait analysis, and checking whether the content is sponsored.

Machine learning would be used to create this algorithm ( some similar projects identified hybrid approaches that used user characteristics from a particular social media as well as the user’s social graph. The algorithm was based on node2vec that allowed extraction from social media followers/followers. )

My project would allow a user interface for interaction and manual news/source credibility check. This project would be unique with the accuracy of the source reliability and work on more than one medium. 

2. Breast cancer detection

Various ways of cancer detection have been detected in recent years as technology and medicine start moving more hand in hand. Depending on the type of cancer, there are different ways of detecting cancer in medicine. For breast cancer, the most common methods of detecting are through MRI, breast ultrasound, mammograms. 

 Is there a way to get the hints of cancer early, before it has developed into its late stages?

 I will be looking at previous work that has been done in integrating the medical records ( images from the methods mentioned above) into an algorithm of image processing and cancer detection. 

I will be using image processing (from MRI, breast ultrasound, mammogram) to explore the historiography method. I will be looking at thermal body scan results as well and comparing these two approaches. For this, I will also explore the work done previously in this field.

I have searched and found various datasets present on Kaggle on mammogram scans.

3. Crime prediction/prevention

This project involves past crime analysis in a particular city (e.g., Boston or Indianapolis), takes the types of crime that happened in one of these locations, and uses machine learning neural networks to predict the possible crime location/hotspot. This project would rely on data mining through the records of crime. 

This algorithm would also consider other features such as economic changes, news, and their impact on the crime rate. I consider taking into account the level of the crime and putting this into the analysis.

Phi – Three Pitches

with No Comments

First Idea: Peer-to-peer chat webapp

This app allows two(or more) people to instantly and directly connect with each other and exchange messages without any third party authorization. It operates completely on a peer-to-peer network, established among the users. This solves the privacy and tracking concerns of users who want to have a personal chat with others without worrying about their data being watched and sniffed. The mechanism is fairly simple: the user can create a meeting, and anyone with the url can join the meeting without any hassle of logging in/authorization. 

Second Idea: Onion routing through an overlay network

Using the already existing IP address as identifier to build a peer-to-peer overlay network.  But instead of naked requests to the server, I want to wrap the request with some layer of protection so that it ensures the data being safe and unsniffed. I want to build a software on the client side that handles data encapsulation and identification in order to join the network. 

Third Idea: Stocks movement based on Social media

This is a AWS Lambda Serverless service that makes requests to Twitter tracking the frequency/occurrences of a stock name being mentioned and how it correlates to its movement in the stock market. The technology that could be used are a couple of Python scripts that make requests and analyze the data, possibly graphing or comparing with the closing price of a given stock. This does not attempt to predict a price in the future, but simply to see if there is correlation between a price movement versus the frequency of its name being mentioned in the social media. 

UPDATE: After some talks with Charlie, the first two ideas can be combined as one. The first two would require more work and harder to iterate but a great source for acquiring the fundamentals of networks. The last one can be a great place to learn about AWS and their services, which is essential in its own right.

Fourth Idea

In the internship this summer, I had many good experience coding and dealing with webservers. But I had one bad experience: I had to web-scrape information for a week. It was a necessary job since we had to gather data for research purpose. But it was gnawing to say the least. At the time I just wish there was better web-scraping technology out there to help me deal with that nightmare. 

I was able to write some software using some library but that did not make my life any less miserable. So I am thinking, maybe I want to make a web-scraper that is more general yet deal with information on a higher level. It can deal with almost any kind of information and any type of communication – whether it is static or ajax at load. And it can gather the common type of information that people search for: name, phone number, email, statistics, etc. 

Pitches

with No Comments

  • Use deep reinforcement learning to tune the hyperparameters (learning rate, lambda – regularization parameter, number of layers, number of units in each layer, different activation functions) of a Neural Network. The overall cost function of RL agent will include the metrics such as accuracy of the NN (or F1 score) on training and validation sets, time taken to learn, the measures of over/underfitting. This network would be trained on different types of problems.
  • For this idea, I’m using the game of Pong (ATARI) as a test environment. My plan is to introduce a specific pipeline in training the AI agent to play the game. Instead of directly using the Policy Gradients, I will train the agent to guess the next frames in the game. First, I will use RNN to learn (approximate) the transition function in an unknown environment. The transition function, modeled by a Recurrent Neural Network, will take previous n states of the game(in raw pixel form) and agent’s action, and output the state representation that corresponds to the future state of the environment. The intuition behind this is that the agent will first learn the ‘laws of physics’ of a certain environment (exploration) and this will help the agent learn how to play the game more efficiently. After learning the weights of the transition function, I will implement the Reinforcement Learning algorithm (Policy Gradients) that reuses the learned weights (transfer learning) and train this deep neural network by letting in play a number of games and learn from experience.
  • I will train a CNN to be able to verify, given the images of handwritten text, if two handwritings belong to the same person. In order to generate more labeled data, I will use a dataset with images of handwritten texts and break up each image into the windows containing a few words. I will assume that each word written on a single image belongs to one person.

CS 488 – Week 7 Updates

with No Comments

For this week, I worked on integrating pieces codes into an application. I completed login and register pages with sql database. Since I usually work on bowie and it is down, I decided to install all dependencies on my local VM. It took quite some time to figure out tensorflow gpu and cpu installations. I also worked on creating a video demo of my project.

CS388 – Week 5 – Update

with No Comments

I read six papers for my three ideas. It was interesting that many research ideas have the same goal, but the ways they approach the problem are very different. For example, in the fall detection problem, some research ideas apply deep learning on images and videos, but others work on radio frequency instead of using the images. Another example of this is improving the performance of the Optical Character Recognition for Chinese text. My initial thought about how to solve this problem is to apply image processing techniques to improve the image quality and then deep neural networks. However, there was one paper approaching this problem from a different angle. They apply statistical natural language processing models such as N-gram in order to improve the accuracy of OCR. These ideas might help me come up with an approach that is different from the one I was thinking of doing.

CS388 – Week 4 – Update

with No Comments

I am reading papers for my first idea, which is “Detect and Translate Chinese text in images”. One research that I read was about improving the performance of the Optical Character Recognition for Chinese books that are in precarious conditions. Instead of trying to enhance the image quality, their research applies N-gram, long short-term memory, and backward and forward N-gram statistics text model to develop a more accurate OCR model.

CS388 – Week 3 – Third Idea

with No Comments
  • Name of Your Project

A Real Time Fall Detection System to Assist the Elderly Using Deep Neural Networks

  • What research topic/question your project is going to address?

The elderly have a high chance of falling and get injured or faint. This might put them to danger if they are alone. One way that can help the elder people is having a system that can monitor their actions, detect the falling action and other behaviors after falling down, classify the levels of severity and send an alert to their emergency contacts or the emergency room if the level is serious.

  • What technology will be used in your project?

Deep learning, pattern recognition, image processing

  • What software and hardware will be needed for your project?

Python, PyTorch (or Keras)

I might also need a CCTV camera if I decide to build the actual device.

  • How are you planning to implement?

First I will apply some image processing techniques to enhance the images and videos quality. If the dataset is small, I will use of image data augmentation techniques to produce more data. Then train the model that detect the person falling in the photo frame using deep neural networks, then use the people falling photos and videos to train a model that classify the level of severity. When the index of severity passes a threshold, send out the alert.

  • How is your project different from others? What’s new in your project?

There are several projects that work on the similar problem. Most of them work on detecting the falling action only. In this project, I hope to build a system that is more detail and can decide whether it is an emergency case.

  • What’s the difficulties of your project? What problems you might encounter during your project?

I might not be able to find a big enough dataset to train the model.

Idea 3

with No Comments
  1. Name of Project

Automating laptop checkouts from CST front desk using image recognition

  • What research topic/question your project is going to address?

Although we need a human to address the needs of guests in the welcome desk of CST, it would be ideal for the worker and students if we can automate the process of MACs’ checkout. Humans are prone to error and we do not want any student worker to be liable of errors that could cost them thousands of dollars. So this project would allow a machine to handle the checkout using a camera to identify the laptop and the student wishing to check out the laptop and remove the process from the desk worker completely.

  • What technology will be used in your project?

Image recognition, machine learning models,

  • What software and hardware will be needed for your project?

This would need a good quality camera, python, and some database management software

  • How are you planning to implement?

Have a camera stationed above the cst desk. Also I think it would be beneficial to change the barcodes in the laptops to bigger QR codes for easy recognition and better visuals for the camera. Use various machine learning models to train the software to recognize students and identify unique laptops. This product should also send out emails regarding reservation details to the students like the current system does.

  • How is your project different from others? What’s new in your project?

This is different implementation from the current process we have in that we are removing human responsibility from this procedure. This will hopefully reduce human error in the process and decrease financial liability to student worker and the institution. It is also scalable to other use cases (like Runyan desk for example) to increase automation and improve efiiciency.

  • What’s the difficulties of your project? What problems you might encounter during your project?

The problem I anticipate is making sure the model I have does not mis-identify students checking out the laptop or mistaking someone walking by the cst desk as someone checking out a product. Lighting might also be some issue as the desk is besides huge windows and so lighting is very different in night vs day, or summer vs winter. Another issue to consider is the camera quality (need to get good camera under reasonable budget)

Idea Number 3

with No Comments
  1. Name of Your Project

Ans: SARS

  • What research topic/question your project is going to address?

Ans: Using trained neural nets to be able to tell when a statement/sentence is sarcasm 

  • What technology will be used in your project?

Ans: NLTK and 

  • What software and hardware will be needed for your project?

Ans: Botmock is the only software that will be needed for this project

  • How are you planning to implement?

Ans: I plan on making this an extension of Botmock

  • How is your project different from others? What’s new in your project? 

Ans: With my project, I am using the same method of using CNN model hierarchy when it comes sentiment analysis to learn the context and space in which the sentence exists

  • What’s the difficulties of your project? What problems you might encounter during your project?

Ans: Every sarcasm exist in a defined space one difficulty of this project is trying to build a barrier for that space. Another problem would be getting access to Botmock’s API to make this application compatible.

CS 388 Idea 2

with No Comments
  1. Name of Project

Visual representation of nation’s development level

  • What research topic/question your project is going to address?

The goal of this project is to use the various world bank data that is available to evaluate different development metrics for each nation. Then I want to use visualization tools to effectively communicate to the interested audience. The visuals will change as the indicators for the countries change so the website would be a ‘live image’

  • What technology will be used in your project?

Api, data visualization tools like Tableau or python, statistical tools to calculate the indicators and compare between nations.

  • What software and hardware will be needed for your project?

Python, SQL, json. Maybe some database management system to store the data. Tableau for visuals.

  • How are you planning to implement?

I want to pull the data from various data sources like the world bank website using api and load it into some sort of database. Using this data, I want to use some tools to calculate and compare the indicators of development for various countries. The output from these calculations would be then visualize in a website live and these visuals would change based on any changes noticed in the world bank dataset.

  • How is your project different from others? What’s new in your project?

I want to create a live version of this problem. I found a few websites that visualize these metrics or tabulate them, but it is hard to interpret for people who are not very informed about the topics involved. I want to make my website very intuitive so people with different experience levels can look and interpret the data intuitively.

  • What’s the difficulties of your project? What problems you might encounter during your project?

The problem I anticipate is figuring out how to have the database where I store my data update in a lively manner so that any changes in the data bank is represented instantly in the website without any intervention required. I will have to learn various methods that are hopefully available readily that can make this possible for me

CS388 – Week 2 – Second Idea

with No Comments
  1. Name of Your Project

Driver Drowsiness Detection Using Deep Neural Networks

  • What research topic/question your project is going to address?

Driving while feeling sleepy or tired is one of the main causes of traffic accidents. One solution for this might be having a device in the car that monitor drivers’ behaviors and facial expressions and ring the alarm if the drivers tend to fall asleep.

  • What technology will be used in your project?

Dataset of facial expressions (images and videos)

  • What software and hardware will be needed for your project?

Python, PyTorch (or Keras)

  • How are you planning to implement?

Build a pipeline that first apply some image processing techniques to improve the quality of the images, then train a model (using neural networks) to detect and locate face position in the images, and the last step is to build a model (also using deep neural networks) to classify the behaviors and facial expressions.

  • How is your project different from others? What’s new in your project?

Most relevant projects track the drivers’ eyes to see if they close their eyes. I am considering checking eyes movements and also other behaviors such as yawning or nodding off in order to improve the classification performance.

  • What’s the difficulties of your project? What problems you might encounter during your project?

There might not be a big dataset for me to use.

CS388 – Week 1 – First Idea

with No Comments
  1. Name of Your Project

Detect and Translate Chinese text in images

  • What research topic/question your project is going to address?

Lately many translator applications have introduced the new feature that can scan a document or take an image with texts to detect and translate the texts into another language.

Many of these applications perform well with very neat and clear handwriting or high quality images but not quite well with cursive handwriting or low quality images. My research goal is to improve the detection performance in these cases.

  • What technology will be used in your project?

Chinese – English Dictionary API

  • What software and hardware will be needed for your project?

Python, PyTorch, matlab

  • How are you planning to implement?

Build a pipeline that first enhance the quality of the image data using image processing techniques, then feeds data to a deep neural network model (maybe CNN) to detect the Chinese characters and connect to a dictionary API to translate the text into English.

  • How is your project different from others? What’s new in your project?

The current applications do not perform very well on low quality images, so my goal is to find solutions to this limit of the translation apps.

  • What’s the difficulties of your project? What problems you might encounter during your project?

I did some experiments and found that big apps like Google Translate still had trouble detecting the not-very-neat handwriting. Therefore it could be very challenging to achieve my research goal.

CS 388 – Week 14 – Updates

with No Comments

This past week, I spent time working on the presentation. I also met with Charlie to discuss the presentation slides. Charlie told me to replace a table in the Motivation section with graphs to show how wildfires have increased overtime. He also told me to cut down some texts in the Related Work sections. For the Proposed solution, he told me to redesign my graph. I also had to add more details in the Timeline and Budget sections. I also worked on the final paper during the break by adding the new requested sections. 

CS 388 – Week 11 – Updates

with No Comments

For this week I looked into many different datasets, including gis fire map data https://frap.fire.ca.gov/mapping/gis-data/ and Kaggle dataset https://www.kaggle.com/elikplim/forest-fires-data-set but couldn’t find what I was looking for.

I picked The Ranch Fire in California but couldn’t find good datasets for it. I was trying to find I’m trying to find elevation, wind direction, humidity, and vegetation. 
All of them have to contain coordinates so I can layer them together. Also, I need each set at different time stamps for the simulation. I will discuss this during the next weekly meeting.

CS 388 – Week 12 – Updates

with No Comments

For this week I have done the following tasks:

Learned to view shapefile contents with Netlogo and Python library pyshp. A shapefile is an Esri vector data storage format for storing the location, shape, and attributes of geographic features. This type of file is quite complicated so it took me sometimes to understand the format and its contents.

I had trouble finding the right dataset for my project. Charlie suggested that I look into https://www.frames.gov/afsc/partners/fmac/guides-products. I downloaded the data for Alaska but it does not have the contents that I was looking for. Finding the right data is currently a big challenge.

I am also getting more familiar with Netlogo. Using Netlogo, I could view the content of the data for Alaska and also extract the metadata using the command line provided with NetLogo.

CS388 – Week 10 – Update

with No Comments

This week I met with Charlie to discuss my project design. We also talked about GIS extension, which is a library to handle GIS data for NetLogo. Charlie talked about how to layer different types of data on a base map. The most important tasks for the upcoming weeks are to figure out how to find different types of data for a fire location and how to process the data.

CS 388 – Week 9 Updates

with No Comments

I discussed my new idea with Charlie and Xunfei. I searched for more papers about 3D modeling and volume estimation but could not find a lot. I will be creating an Andriod application, so I looked into Andriod camera API and found that I can specify the distance between the food and phone camera until it satisfies the requirement. I plan to include face recognition as authentication for privacy purposes and found a GitHub repo for it that I can use. I also found a paper that is more closely related than what I have found so far.

CS 388 – Week 8 Updates

with No Comments

After coming back from CMU workshop for CS researches, I have decided to modify my idea a bit to integrate more CV into the project. From recipe recommendation and calorie estimation, I have decided to focus only on calorie estimation. There are many calorie estimation software that requires users to have a reference object when taking a picture of food. As much as this method has brought food calorie estimation to a new level of accuracy, it is inconvenient for users as they need to have the reference object with them at all times.

In my project, I aim to solve this problem as well as to bring the accuracy of calorie estimation to another level. Users will scan the reference object the first time they set up the application. The scanned object will be saved in the database as a 3D object with its area and volume. Next time the user scans the food, the object will appear next to food. These two will be compared and extract the volume of food from it. From volume, the calorie of food will be estimated.

CS388 – Week 9 – Update

with No Comments

For this week, I started working on NetLogo, the software that I plan to use to create the simulation model for my project. I looked into the tutorials and the sample models library. NetLogo has its own programming language and development environment, so I spent quite some time to study its ecosystem. I also created a simple simulation model that read a file containing elevation information, display the elevation in different shades of green, built some fire sources and let them spread to places where elevation was smaller than 500. All of my notes for NetLogo can be found in Box.

Charlie and I also discussed my design for the project. For now I will focus on four types of input: Wind, Elevation, Temperature, and Humidity. First I will explore them individually to see how each affects my model. Then I will combine them, two at a time, to explore their combined effect on the model.

CS388 – Week 8 – Update

with No Comments

I met with Charlie for the weekly meeting. We discussed different designs for my simulation model. I will first create some input data, which includes creating dummy values for the base map instead of using a real map. The main program will contain simple transition functions. This is to make sure that I can produce a simple version of a simulation model. I will also have to look more into NetLogo, especially into its fire model libraries.

CS388 – Week 7 – Update

with No Comments

I’ve finished writing the Literature Review for my idea “Fire Spread Simulation Using Cellular Automata.” After reading the papers for my research, I found a recent paper on this topic which used Machine Learning to solve the drawbacks of previous research. However, I could only find one paper using this technique so I will have to dig deeper to find more related materials. Charlie has suggested that I should categorize the papers based on the input data (terrain, weather condition, etc).

CS388 – Week 6 – Update

with No Comments

I’ve chosen “Fire Simulation Using Cellular Automata” as my final idea. I have also met with Charlie and decided to meet every week on Monday. I will also meet with Xunfei regularly for my research. Xunfei has suggested that I should look into ArcGIS for the simulation part of the research and also suggested me to talk to Jose as ArcGIS would require funding.

CS 388 – Week 6 Updates

with No Comments

I have decided on the project I will be working on as my senior project. I have talked to Charlie about it, discuss my ideas regarding this project. He will be my advisor for the project. I have found 10 more papers and a couple of technologies I might be using. I have also found the datasets of food and recipes I will be using for my project.

My final idea is nutrition management and recipe recommendation system. Users will be able to scan the ingredients they have using the app and the app will recommend recipes using the user input they have put before such as any allergies, or food they don’t want to or cannot consume. The next step of my project will be the calorie estimation of food the user will consume. For this part, I plan to use a texture mapping and scanning for the optimum estimation of calories, and ingredients. For the privacy issues, I plan to have users scan their face on the first use of the app and have an API that will determine whether the current user is the user of this account. I am still thinking about possible ways to detect liquid ingredients and seasonings of the food.

CS388-Week5-Update

with No Comments

Here are my comments for the papers I read this week.

[1] Forest fires spread modeling using cellular automata approach.

They described a method using cellular automata to simulate how fire spread over an area of island Brac in Croatia. The paper had a great overview of Classification of forest fire models, explanation of cellular automata, well-known Neighborhood Templates, and how Landscapes can be represented as cellular automata. They mentioned that only vegetation characteristics and wind conditions were taken into account as input parameters. I might include more input data if I use this model.

[2] Computer vision system for fire detection and report using UAVs Special Issue for Submission.

The main concerns of the paper was how to detect fire using computer vision techniques as well as hardware systems. The paper serves as an explanation to their system rather than how their system is compared to other fire detection models. I might use this pa- per for my research if I want to establish a communication system later on.

[3] Using cellular automata to simulate wildfire propagation and to assist in fire management.

Unlike the cellular automaton mentioned in the other two papers, this one did not take into consideration the state of stress of vegetation and the meteorological condition. If it possible, I would like to develop a system that can output different simulations based on different cellular automata models based the ones in this paper and in the other two mentioned above.

[4]  An FPGA processor for modeling wildfire spreading.

The model was designed to not require too much computational resources and computational power so that it could describe fire behavior in real time. I might use this model if I want to design my simulation model in real time.

[5]  A Cellular Automata model for fire spreading prediction.

The result was a model of cells that evolve with given transition rules. This model forms the basic foundation my research. I can implement a similar model with these transition rules.

[6] Forest fire spread simulating model using cellular automaton with extreme learning machine Extracting Traffic Events and Human Mobility Patterns in Geosocial Media Data for Assessing Real-time Road Traffic View project Understanding human activity pattern.

They mentioned that the accuracy of this model was between 58.45 and 82.08%. I do not think a simulation accuracy of 58.45% is a reliable. This research also used cellular automaton to pre- dict fire propagation, which is similar to the paper ”Forest fire spread simulation algorithm based on cellular automata.”

CS 388 – Week 4 – Update

with No Comments

Below are the papers I read for each idea this week. I also read more papers for my third idea, “Fire Spread Simulation” and found the cellular automata algorithm mentioned in one of the papers quite interesting. The basic idea behind the model is to break down the images of the forest fire into different cells and apply the same algorithms onto each cell, similar to divide and conquer. The authors have also developed an improved algorithm based on this model to not only predict how fire spreads but also trace the source of fire.

Improve Fire Identification Mapping and Monitoring Algorithm (FIMMA) 
[1]  Z. Li, W. Jiang, F. Wang, Q. Meng, X. Zheng, and B. Liu, “GIS based dynamic modeling of fire spread with heterogeneous cellular automation model and standardized emergency management protocol,” Proceedings of the 3rd ACM SIGSPATIAL International Workshop on the Use of GIS in Emergency Management, EM-GIS 2017, 2017.
[2]  X. Xie, J. Wang, H. Qin, and X. Cheng, “The simulation and research of fire spread situation based on osg,” ACM International Conference Proceeding Series, pp. 156–159, 2019.

Fire Detection Using A Combination of Different Image Analysis Techniques

[1]  L. Giglio, W. Schroeder, and C. O. Justice, “The collection 6 MODIS active fire detection algorithm and fire products,” Remote Sensing of Environment, vol. 178, pp. 31–41, jun 2016.
[2]  Y. Long and X. Hu, “Spatial partition-based particle filtering for data assimilation inwildfire spread simulation,” ACM Transactions on Spatial Algorithms and Systems, vol. 3, no. 2, aug 2017.

Fire Spread Simulation 
[1]  X. Rui, S. Hui, X. Yu, B. Wu, and G. Zhang, “Forest fire spread simulation algorithm based on cellular automata,” Natural Hazards, vol. 91, no. 1, pp. 309–319, 2018. 
[2]  S. K. Singh and S. Kanga, “Forest Fire Simulation Modeling using Remote Sensing & GIS,” International Journal of Advanced Research in Computer Science, vol. 8, no. 5. [Online]. Available: https://www.researchgate.net/publication/325848449 

CS388- Week3- Update

with No Comments

For this week, I read the papers on Moodle, met with Charlie to discuss my ideas, and read papers related to them. Below are some updates for each topic.

Idea 1 Title: Improve Fire Identification Mapping and Monitoring Algorithm (FIMMA)

Description: Enhance FIMMA to reduce the number of false-positive results and apply the algorithm to detect fire in urban areas.

Update: This algorithm has been developed for the past 20 years by NASA. It has gone through many modifications and enhancements, and is currently producing quite accurate results. The main reason why it cannot detect fire instantly is because of the time the satellites take to circle the Earth.

Idea 2 Title: Fire Detection Using A Combination of Different Image Analysis Techniques.

Description: The research aims to detect fire by analyzing different attributes (heat, temperature of the surrounding area, temperature and color of the smoke) at different ranges of the electromagnetic spectrum (UV, visible, and infrared).

Update: There have been numerous unmanned vehicles being developed to take images of a fire scene at different electromagnetic spectrum. A drawback of detecting fire using image analysis might potentially lie with the hardware rather than the analysis techniques. For example, the resolution of the images and the hardware of the camera are usually affected when the vehicles try to take photos too close to the fire source.

Idea 3 Title: Real-time Fire Tracking System.

Description: The research aims to create a system that can provide current data for active fire as well as calculate the direction it is moving. The system can combine the data from Google Earth and NASA’s Fire Map to provide the current condition of the fire. It will also need real-time data of a given location, particularly weather (wind, humidity) and local condition (population, buildings) in order to make predictions. 

Update: Since last week, I have been focusing on this idea more than the other two. What I am planning to do is to build a system that can produce a simulation of how an active fire spreads in a specific fire situation, particularly in forest fire. Many factors will have to be considered to build this simulation, especially data about the surrounding environment, weather, and terrain, etc. I plan to use archived data so that I can compare my predictive result to the actual fire spread direction.

CS 388 – Week 2 (3 Ideas)

with No Comments
  1. My first idea is to create an application that scans the picture of foods and let users know what ingredients are in the dish. I am still deciding whether I want my app to be used as a diet and nutrition guide or aid for visually impaired people. This application will be available in multiple languages (at least 3). Xunfei had provided me more questions to explore as feedback. I will integrate computer vision and natural language processing in this project.
  2. My second idea is a program that detects prank calls made to 911 or other emergency centers. I will focus on details of the caller’s speech such as the urgency, intonations, breathing, etc. as well as background noises like whether the background is too quiet or too loud or is there any footsteps, etc.
  3. My third idea is to generate speech from a user’s hand gestures in several languages. I plan to piggyback an already existing and working program that translates hand gestures to speech. My main focus will be on improving that program and working to the accuracy of language translations.

CS388 – Week2 – Three Ideas

with No Comments

1 ) Name of Your Project: Improve Fire Identification Mapping and Monitoring Algorithm (FIMMA).

Enhance FIMMA to reduce the number of false-positive results and apply the algorithm to detect fire in urban areas.

2 ) Name of Your Project: Fire Detection Using A Combination of Different Image Analysis Techniques.

The traditional methods to detect forest fires such as using mechanical devices or humans are not effective on a global scale. With the advancement of technology, detecting forest fire using image analysis has proven to be promising due to its low cost and effectiveness on a global scale. However, these analyses generally focus on only one technique, either analyzing the images in one range of the electromagnetic spectrum or study the heat signature of the fire. The research aims to detect fire by analyzing different attributes (heat, temperature of the surrounding area, temperature and color of the smoke) at different ranges of the electromagnetic spectrum (UV, visible, and infrared).

3) Name of Your Project: Real-time Fire Tracking System.

A wildfire usually spreads rapidly within hours from the start, which means responding quickly to the fire can lead to fewer damages and casualties. The research aims to create a system that can provide current data for active fire as well as calculate the direction it is moving. The system can combine the data from Google Earth and NASA’s Fire Map to provide the current condition of the fire. It will also need real-time data of a given location, particularly weather (wind, humidity) and local condition (population, buildings) in order to make predictions.

CS388 – Week 1 – First Idea

with No Comments
  • Name of My Project

Managing Fire From Space

Improve Fire Identification Mapping and Monitoring Algorithm (FIMMA).

  • What research topic/question is my project going to address?

Space technology has been used to improve life on Earth through many applications. One of them is to use Earth observation satellites to detect forest fires and alert local authorities in real time.

NASA has been developing FIMMA algorithm that analyzes data taken from Earth observation satellites to detect possible forest fires.

The FIMMA algorithm has several limitations, which often leads to false-positive results. The research aims to address and find possible solutions to the current limitations and produce a better algorithm.

  • What technology will be used in your project?

Fire Information for Resource Management System (FIRMS).

  • What software and hardware will be needed for your project?

Data manipulation and graphing tools.

  • How are you planning to implement?

Compare the current implementation of FIMMA algorithm with other fire detection algorithms and fire products.

  • How is your project different from others? What’s new in your project? 

The algorithm is currently only accurate over forested regions. The algorithm may miss real fires over urban areas, as well as many agricultural burns. A focus of the research is to improve the fire detection accuracy of these regions.

  • What’s the difficulties of your project? What problems you might encounter during your project?

The research requires a deep understanding of the algorithm, geology, satellite technology, and data science.

It can be challenging to obtain the most updated progress of the algorithm.