Paper: https://drive.google.com/file/d/1Aen6Bbt4NDHxidx80EylAWiHLMbSAXWH/view?usp=sharing
Poster: https://drive.google.com/file/d/1fYgnOszH2dKVXQ5P1I1GgKpVAZUJjZNu/view?usp=sharing
Code and demo: https://github.com/fcurrin/viz
This week I made some minor changes to the python script so now the generated file is in the right format. I also made some major changes to my paper and have an updated draft of it. Next week I’ll be able to get together a draft of my poster and then I should be pretty much set to start extending this work in my psychology capstone next semester.
This week I re-structured things again. I decided to look into other methods of generating a visualization and decided to separate that process out from NVDA. Under this design, the developer runs NVDA with my plugin installed and that generates a text file. Then the developer navigates to my web-based visualization tool, uploads the file, and then views the generated visualization. I have a working demo of the visualization tool now, but I’m still working on ironing out some of the issues in generating the text files (specifically coming up with a method for splitting the chunks pulled out appropriately).
At this point, since I’m still having issues with DrawString, I decided to start looking into alternative options. My adviser recommended that I look into Tkinter again, but after some playing around with it and digging into it, I learned that Tkinter is fundamentally incompatible with NVDA because it does not produce accessible content. wxPython is often used to make NVDA-related GUIs, so I looked into that some but I don’t think it will let me make quite what I want to, so I’ve decided to back up and change plans slightly. I’m going back to the idea of just creating a clean-as-possible transcript of what information NVDA is able to gather when it’s running and developing a script completely outside of NVDA that can take that transcript and create a visual representation from it. I’ve started working on the transcription script and will hopefully have that done by the end of the week so that over the weekend I’ll be able to get a visualization together and ready to present.
I found this function to create a font and played around with it until I had a version that was recognized by the GdipDrawString function. Now I have code that compiles without errors and causes no runtime errors, but the text is still not displaying (or maybe just not displaying how & where I thought it should). So I still need to play around with that problem, but at least I know that I have found a function that produces the right type of thing to pass to GdipDrawString.
I spent quite a bit of time this week drafting my paper and sent a rough draft to my adviser Friday. He responded quickly enough that I was able to make revisions before submitting a draft for grading. Overall I’m happy with the way the paper is shaping up.
This week I’ve focused primarily on drafting my final paper. So far I have a general outline of my paper (abstract –> introduction –> related work –> framework and design –> implementation –> conclusions and future work), and I’ve fully drafted the abstract, introduction, and related work sections. I have a clear idea of what I want to go in each of the other sections, so I should be able to have those sections fully drafted by this time next week.
In terms of the software development component of the project, I almost have a complete (although not especially fancy or sophisticated) visualization tool, but I have spent most of the last week making lots of progress at getting nowhere. All I absolutely need at this point is to figure out how to make a call to the function GdipDrawText, but because gdip is the way python handles GDI+ — a component of .NET made to work for C, C++, and C#, the documentation on it is fuzzy and somewhat sparse. I still have a couple of ideas to try, though, and I’m trying to find people who have experience using it.
This week I started playing around with creating the visualization tool piece of my project. In doing that, I learned a lot of the more finicky details of NVDA. It uses an internal installation of Python, which makes sense for users because they don’t need to already have Python installed on their machine to use NVDA. However, this makes installing packages more difficult and requires basically copying and pasting the contents of the package into a directory within the NVDA set up so that its installation of python can use it. To test small changes I want to make, I’ve found the NVDA Python console to be really helpful, but it’s only accessible when NVDA is running which can sometimes slow down the testing process. Overall, I feel like this project has gotten me really into the weeds and I’ve begun identifying specific problems in the way NVDA tries to go about reading this type of content, but I’m not entirely sure of what solutions would best fit with the existing NVDA structure.
I found some quirks and issues with the way NVDA works in different settings. I can now get a transcript with the appropriate details by using object review mode in Firefox, but not by navigating the objects normally or while in Chrome. This gets at the issue of “not knowing what you don’t know” and screen reader users needing to have significant experience and ideas of how to work around poorly designed web layouts. Because at this point I don’t believe there’s an easy way to generalize the automatic transcript making and restructuring process, I think identifying these issues and barriers and creating example demonstrations may be the best end result for my project at this point.
This week I’ve gotten minorly stuck. I know that NVDA is able to grab — and speak — certain information about the data visualizations I’ve created(it might say, for example, “graphic New York” when I navigate to a point representing the population of New York). But when I try to grab information about those navigator objects, I end up grabbing objects whose roles are either “unknown” or “section.” These objects also don’t have names, descriptions, basic text, or any useful attribute containing the text information NVDA is able to provide, but isTextEmpty also consistently returns False. At this point I’m not entirely sure where I should be looking to keep digging — I’ve looked into the code for NVDAObjects, TextInfo, speech.py, etc. I’ve also dug into forums and things and found an NVDA development mailing list, so I posted a response to a forum thread asking for clarification about something that might be relevant to this issue and sent a more detailed account of the issue I’m facing and request for guidance to the mailing list. Hopefully I’ll get this sorted out by this time next week.
I’ve been researching Voronoi graph regions and their usage in recommendation system. I’m particularly interested in finding open-source implementation of Voronoi graph regions usage. I’ve also been reading and researching FiveThirtyEight’s gerrymandering maps and how they created their maps of different districting schemes. I am especially interested in the algorithm they used for one of the districting plans. Lastly, I decided on a mapping tool, Leaflet, which is an open-source JavaScript library for interactive maps. I started building the visualization tool using Leaflet and the algorithm taken from FiveThirtyEight.
Met with my advisor twice, worked on an updated timeline. Worked out a design framework and prepared the presentation slides.
This week I revised my proposal, framework and timeline. These revisions are summed up in my presentation for this week (slides can be found here).
In this past week, I’ve found and simplified 2 types of data visualizations that I think would be useful for testing purposes: a slopegraph and a bubble graph. I’ve run some preliminary tests with NVDA on them to see how it’s trying to process them and developed basic plans on how to process that information in a way that makes more sense to NVDA.
In the upcoming week, I plan to finish gathering my data visualization test sets and coming up with those early transformation ideas and begin looking into how to get NVDA to transcribe what it’s looking at and output that to a file so it’s easier to track and document its process.
This past week I reached out to Dave and he agreed to be my mentor for this project and prepared my presentation slides based on my project proposal. I dug into the NVDA developer’s guide and walked through some basic examples of creating and testing NVDA add-ons, so now I have a better understanding of what developing an add-on looks like. I met with Dave to go over my general approach and strategies to adapt that approach as necessary as time goes on. I also reached out to the director of the program where I worked over the summer to ask her to connect me with a colleague of hers or one of his students who have done more work in this space and who could help me especially at this stage of my project.
In the upcoming week I hope to develop criteria for the types of data visualizations I’ll be focusing on and begin creating examples of those and playing preliminarily with how NVDA digests them. I’d also like to go back over my literature review and begin working on paring it down some and shaping it into a Related Works section of my final paper.
Final poster of sensoring real-world enviornment and predicting using Machine Learning.
The finalized poster for EPIC Expo is attached here, on the addition of new training samples to a decision tree.
The finalized poster is attached to this post. CS488Poster_Niraj
This past week I set up a git repo for my senior research, and am now working to create a system diagram for my project.
In addition, this week I will be working through the source code of scikit-learn to better understand how they create their decision trees, and identify which parts of the extensive source code are required for my project, so as to reduce the space required for the research.
So this week I went to get DOCK, found out that I need a license to use it, and that licenses are free for academic purposes. I’ve got a DOCK license and I’m working on learning the ins and outs of it, but I’ve got a pretty good handle on it already.
Things I have to do for the project to be finished:
[X] – Not done [O] – Done [I] – In progress[O] Get a DOCK license [I] Familiarize myself with DOCK [I] Get a linux VM set up that can run Singularity [X] Install Singularity [X] Create Singularity Virtual Machine [X] Write Paper
Background
As a student I have realized that being able properly understand my personal academic data is very
important. From grades and transcripts to majors and courses, I need to be able to clearly acquire the information about my academic standing. We can take for example the data for a student’s degree progression. While a college degree has it’s hierarchy (a degree can be broken down into majors, minors and general requirements, majors can further be broken down into first year courses, major requirements and electives and so on), the course progression each semester is also chronological. Thus, I believe that the idea of using both treemaps and timeline data visualization for such data seems to be an idea worth exploring.
The Idea
Studying at Earlham College, it seems only natural that I’ll work with Earlham College’s degree progression data. As of right now, Earlham College provides information on academic standing (including, majors, grades, courses taken, etc) using a web based platform called Degreeworks. While Degreeworks does have all the relevant information, it lacks presentation. Thus, many students can’t really see the big picture. The interface is very traditional and major chunks are divided into lists. It’s difficult to imagine where you are in the road map to graduation by just staring at the list. A student can see that they have taken x credits out of 120 credits for their graduation requirement and y credits out of z requirement (for majors) credit. However, there is no relativity. These two things seem very disjointed even though they are deeply connected.
My goal for the senior project is therefore, to create a visual version of the Degreeworks which I call Degreeworks V2. By providing this visual interface for Earlham Degreeworks, I want to help Earlham College students to effectively visualize their academic standing. Like I discussed earlier, I will be using treemaps and timelines in order to visualize the data. Like I said, just being able to know how manycredits I have taken or how many are left does not give me a good sense of where I am. Neither does looking at a list of electives. If we can visualize this data, I think it would
hugely benefit the students as well as institution.
Software
Like I discussed in my survey, D3 (short for Data driven documents) is one of the frameworks that provides processing capabilities . D3 is a domain-specific programming language that uses these algorithms to provide a library of classes and objects to create data visualizations including treemaps and timelines. D3 is a JavaScript based framework. However, if I go with the web-based option, I might need a little bit of php to connect to the database.
D3 does most of the rendering for us so the frontend work is limited to styling the visuals. I will useHTML for page content, CSS for aesthetics and SVG for vector graphics while a further JavaScript layer can be added for interactions.
For this week, I reviewed the source material on decision tree creation, attempting to further my understanding, and think about where to begin editing.
For next week, I will be setting up a git repo with the source code from sci-kit learn, and begin to work on the design of how to add more data.
Background
Ever since their introduction in the late 2000s, smartphones have been changing the landscape of people’s daily lives. As these devices get more popular, they are also getting more powerful. Today, we can hold in our hand a device that is more powerful than a room full of computers in the 1960s. Not only this, smartphones today come with sensors like accelerometers, gyroscope, magnetometer, GPS, ambient light sensor and so on. Human activity recognition utilizes the increased computational power of smartphones and their diverse array of sensors to collect raw data from a subset of the phone sensors, use the computational power of the phone to detect motion patterns and recognize the activity that the user is engaged in.
Fitness monitoring trackers like fitbit and android watch have also steadily gained popularity worldwide. This reflects the increasing demand for ways to monitor fitness. Activity recognition also presents us with a marvelous prospect when it comes to fitness monitoring. Using techniques employed in activity recognition, not only will users be able to track the number of step taken, the number of calories spent, the number of stairs climbed, the number of hours slept, their quality of sleep and distance traveled but smartphones can also be used to alert idle users to move around if it notices that they have been sitting for too long. Since no extra sensors are required and they are accessed through the smartphone, these applications are zero cost and easy to use. Therefore, my motivation behind this project is to provide an affordable means of monitoring fitness through an Android device.
Software
The final product of my project will be an Android (possibly cross-platform) application that comes with a trained classification model (possibly based on decision trees) capable of classifying activities into separate classes based on the current input data stream from sensors like accelerometer, magnetometer, gyroscope, etc. Furthermore, the application will also keep track of how many steps the user has taken, stairs climbed, hours slept, distance travelled and so on. I plan to build a suitable visualization within the application to allow the users to better understand the data.
Paper
My paper will contain a detailed description of the framework I used to build the application, as well as the techniques I used to extract features from training and test datasets. Also, in this paper, I will justify my choice of the machine learning algorithm used and the visualization techniques used. More importantly, I will evaluate the accuracy of the current model and suggest further ways to improve on it.
Background
Cities are complicated systems that consist of numerous interconnected citizens, businesses, various transportation modes, services, and utilities. Scientists expect around 70% of the population to be located in cities and surrounding areas by 2050. Hence, the demand for smart cities which would provide everyone with high-quality services and ensure a suitable environment for economic and social well-being has appeared. Smart cities are mostly driven by the Internet of Things (IoT). A major part of costs that city municipalities face come from data collection. IoT applications in smart cities are argued to have a significant positive impact on efficiency and cost saving.
Garbage is a direct source of spreading diseases in underdeveloped countries and it contributes to the overall estimation of how clean an environment is. Since garbage collection process has to be repeated continuously, some countries simply cannot afford it which leads to some portion of garbage not being picked up. Studies have shown that garbage directly influences life expectancy which makes it a very important issue to be considered by governments all over the world. That is where the question arises of how to get a good implementation of waste collection system at a price that government can afford. The aim of my project is to create an affordable waste monitoring system that takes advantage of IoT, historic data, and various routing techniques.
Software and Hardware
The final product of my project is a waste monitoring system that consists of Arduino board mounted directly in the garbage bin along with ultrasonic sensor and RF transmitter, Arduino board acting as a control center with RF receiver, and software that connects all of the specified components. An ultrasonic sensor is capable of detecting the distance to objects it points to. Therefore, it can be used to measure garbage can fill level. Arduino board within a trash bin will continuously receive this information and send it using RF transmitter directly to the control center at every specified period for further analysis. The control center will receive this data using RF receiver. Later on, the software will analyze received information and make adjustments to routing plans for near future if a given value falls within a warning or critical zone. Such a system will create routing and scheduling policies that reflect a real-time data collected at physical locations of garbage bins.
I acknowledge that testing a full-scale monitoring system will be impossible with an amount of time and hardware components available to me. Therefore, after coming up with a prototype of the monitoring system, I will run simulations based on available data from Dr. Charles Peck of waste collection services within Richmond, IN. This approach will let me evaluate the effectiveness of a proposed system without necessarily setting up a complete system and complete a result section of my paper.
Paper
This paper will provide good background information about IoT and it’s applications in smart city. The primary focus of the paper will be to evaluate the effectiveness of the created waste monitoring system, various routing policies etc. Additionally, this paper will suggest optimal techniques that minimize the garbage spread based on the available resources.
Aim of the project
More and more large-scale Monte Carlo simulations are now run on parallel systems like networked workstations or clusters. In a parallel environment, the quality of a PRNG is even more important, to some extent because feasible sample sizes are easily 1015 times larger than on a sequential machine [2]. The main problem is the parallelization of the PRNG itself. Some generators with good quality that do not run on parallel sacrifice their efficiency. Those parallelized generators cannot ensure their quality. This problem
becomes even difficult for TRNGs, due to their nature of instability of quality and complex implementation for parallelization and them- selves. Therefore, I think it is important to resolve this problem with a stable RNG design runs in parallel that can generate random numbers on a large scale. If applicable, I will definitely go for a TRNG based design. However, given the difficulties of imple- mentation and limited hardware knowledge, I will not feel guilty if I end up with a PRNG design.
Software and paper
The software of this project will be divided into two parts. The first part will the interface of TRNGs or the source code of a PRNG design. The second part will be a set of statistical test to certificate the randomness of output stream. My paper will introduce my implementation and design in great detail, including how to bring ordinary RNGs into parallel and how to optimize them for large scale purpose. It will also include a result analysis part where I run statistical test against sample streams. The success of a design is dependent on whether the design is able to generate random numbers on large scale and how successful (i.e. how many tests can the output pass) the output stream is.
In machine learning, there has been a shift away from focusing on the creation complex algorithms to solve problems. Instead, a large focus has been on the application of simpler algorithms which learn from datasets. This shift has been made possible through the ever-increasing computational power of modern computers, and the massive amounts of data generated and gathered through the internet of things. However, even given the power and storage cheaply available for creating these models, it can still be quite time and space intensive to make a useful machine learning model. Datasets can vary in size, but can range from hundreds of thousands, millions, or even billions of unique data points. Due to the copious amount of data, training even a relative fast machine learning model can take hours or days. Because of how time and resource intensive that process is, companies often wait to recreate the model, even though they may lose some performance due to it. Some companies even wait to do it on a monthly basis, such as CoverMyMeds, who update their models every 28 days.
Part of why updating models is so intensive is that many do not allow data to be added after they are initially trained. This means each time you want to add data, you must create a new version from scratch, using the old set and the new points. Other types of models do allows this though, so it is possible to add it. The aim of my research focuses on learning how to add data dynamically to the model from neural networks, a machine learning algorithm based off of how the brain works with neurons, and apply similar logic to classification decision trees. The hypothesis of my research is that the time intensity of updating a decision tree can be decreased by adding data incrementally, with little loss to the tree’s effectiveness.
Paper
For the paper associated with this research, I will focus on the theory behind neural networks and their dynamic data addition, how decision trees are created, and how I will be adapting their training to mimic the behavior of neural networks when it comes to training. However, it may not be the case that decision trees can be changed to act as neural networks do, but can be edited in some other manner. To confirm or discredit my hypothesis, the resulting software will be tested on a series of datasets which range in size, type, and topic, and recorded in the paper.
Software
For the software component of this research, I will be reviewing, editing, and testing the sci-kit learn package in Python, which comes with well-tested and documented implementations of both decision trees and neural networks. These will be gathered into a Git repository, along with the relevant datasets, my edited version of the code, and the necessary files to run to test the results.
No matter how developed technologies may become, humans need to consume food and convert into energy. Autotrophs, usually are plants, take inorganic compounds and convert into organics which then could be digested by animals. Growing a feeble seed into a mature plant has always been carefully manually processed which is time consuming for large quantities. A sole seed takes approximate 7 days to germination, and the germination rate is difficult to control. In addition, different species require distinct environment even an expert could not predict the germination rate. Fully automation could not only help to reduce the resources cost but increase the efficiency as well. First, it is much more precise on each environmental condition, thus making sensitive changes more quickly. Then, with precise adjustment, reducing chemical waste and energy lost which means the cost would be decreased. Among developing countries, starvation is still a daily problem that needs to be considered.
Paper: As for paper, I will be mainly concentrate on the development of software frame and the interaction between the agent and the environemnt. Since this project is heavily depend on using machine learning to make rational decisions, applying algorithms to analyze data is essential. In addition, precise sensors could collect data which then should be labbled and pass on the the agent.
Software: Althogh this is a project involving both software and hardware components, using certain algorithms (such as Bayesian networks) to process collected data and make rational decision is critical. Upon that, by analyzing data from the past, a future prediction could be made for productivity and cost.
The technology of blockchain has reached the mainstream conscience as a result of the popularity of Bitcoin and other cryptocurrencies. Blockchain as implemented in Bitcoin is a distributed ledger system in which transaction history is maintained by a consensus of participant nodes. These participant nodes also compete in using proof of work to decide the block of transaction added to the chain. This system has the benefits of being totally decentralized and creating a nearly unalterable transaction history. However, the proof of work method is resource intensive and slow. Another cryptocurrency, Etherium uses a consortium variation on blockchain in which a subset of participant nodes are selected to determine the next transaction block added to the chain. It is this consortium blockchain which my project will be based on.
In the healthcare industry of today data privacy is a major concern. There are numerous examples available of healthcare providers failing to maintain the security of their patients’ data and being hacked. As Internet of Things devices become more commonplace they will play an ever grMy senior project will focus on using blockchain technology to connect Internet of Things devices, specifically in a healthcare context where patient data is of high security concern. The implementation will make use of the consortium blockchain concepteater role in healthcare and form the basis of smart healthcare. Of primary concern with this fact is being able to secure these devices of low computational power. My project will use the consortium blockchain previously mentioned to secure such devices and improve the security of the data being transfered.
Paper
My paper will delve into the technology of blockchain and specifically focus on consortium blockchain. It will explain what the Internet of Things is and how these devices pertain to healthcare. And it will bring the two together explaining how a blockchain will provide increased security to an IoT network and how it allows providers to remain HIPAA compliant.
Software/Hardware
The hardware component of my project will utilize affordable single board computers (SBCs) like CHIP to model healthcare IoT devices. These SBCs will be set up in a network similar to one that could feasibly be found in smart healthcare. Additionally, another SBC or a more powerful computer, if need be, will be used as a sort of aggregator. For my blockchain implementation I will use the University of Sydney’s Red Belly Blockchain with the Linux Foundation’s Hyperledger as a backup. My code will use the blockchain framework which is currently geared towards currency and tweak it for communication. My prediction is that this repurposing will present the bulk of the challenge and time commitment for the project.
The paper of my project will be developed based on the proposal. And the software components of my project are all listed in the proposal.
The proposal is attached below.
With the non-stop improvements in technology, more and more fields are trying to apply computer science to achieve their goals in a more efficient and less time consuming way. Sports are no outsiders to this group of fields.
In sports, especially in soccer, technology has become an essential part. Soccer experts now make use of technology to evaluate a player’s or a team’s performances. Other than using their experience and their management abilities after many years being parts of the game, the soccer coaches also use statistics from data providers to improve their knowledge of their own players and teams so that they can come up with different strategies/tactics that bring them closer to the wins. Besides coaches, soccer analysts also make use of the data to predict results in the future as well as evaluate new talents emerging from the scene.
This is where Machine Learning techniques can become useful. Machine Learning is one of the intelligent methodologies that have shown promising results in the domains of classification and prediction. Therefore, Machine Learning can be used as the learning strategy to provide a sport prediction framework for experts. The end goal of this project is to produce a program/script that will automatically execute the complete procedure of results prediction.
Paper Plan:
For the paper, there should be several sections that explain the framework of using Machine Learning to predict results in the English Premier League. This will include basic knowledge about soccer and the League, data preparation and understanding, feature extraction (Scikit-learn, Machine Learning algorithms/models, Selections), training and testing. Other than those sections, I will also discuss the results of my program/script in my paper from predictions for the upcoming matches. Finally, I will talk about the difficulties/obstacles of the project, the conclusions, and a few possible directions for further development of this field/topic.
Software Plan:
For the programming part, my plan is to just create a basic program/script that can carry out every step needed in the process of predicting the future results. This starts from writing code that retrieves the data from the source stated above and preprocesses the data in an usable format. As said above, during the course of the project and after training and testing have been performed, the best performing features and Machine Learning algorithms (provided and tested by using Scikit-learn) will be determined. I would then set those features and algorithms to be used in the program.
My current idea is that the program will first ask the user for the home team and the away team. Then, it will use the decided Machine Learning algorithms to predict the result between the specified teams and print that result out to the screen. However, the user can also choose to predict the 38 matches of one team for the whole season. The program will then write the predictions to an output file which can be accessed by the user.
My senior research is on adapting how decision trees in Python add data, to allow them to grow further after their initial creation. By allowing data to be added later, we can greatly reduce the time required to update a model in production. Please find attached a copy of the proposal for this research.
In the past couple of decades, there has been a significant growing amount of research on Natural Language Processing (NLP) which has largely been motivated by its enormous applications. Some of the well-known systems that use NLP techniques include Siri from Apple, IBM Watson and Wolfram|Alpha. There has also been much work done on building efficient NLIDBs that allow people without SQL backgrounds to query a SQL database in natural language. For instance, a research team at Salesforce developed WikiSQL with the aim of democratizing SQL so databases can be queried in natural language. WikiSQL is a large crowd-sourced dataset for developing natural language interfaces for relational databases that generates structured queries from natural language using Reinforcement Learning.
The purpose of my senior project is to solve the inequitable distribution of a crowd’s resources. The goal is to build a large Natural Language to Interfaces Database System for the Sharing and Gig economies. In other words, this means building a database of our current resources and services that can be queried and modified in the English natural language.
Given the scope of this project I will start with a small database for the Earlham student community. The application will connect students with certain needs with students who can fulfill those needs. I will start with simple queries and sentences related to the following contexts: Homework, Transportation, and sharable items.
Facilitating the connections between crowd members requires communication between the users and the database. The functionality of the application will be dependent on the constant input of information from users about their daily activities so that the algorithm will be better able to connect users. I realized that communicating with a chat-bot in natural language will be the best option to facilitate the constant input of information. I decided to use one the most widely used relational database management systems, PostgreSQL. Hence, the goal of this project is to democratize SQL so that users can query the SQL database in natural language (for example: “Who graduated from Earlham College this year?”) and modify the SQL database in natural language (for example: “I graduated from Earlham College this year”). There is huge potential in such systems where people can query a database system using natural language as it can create accessibility to a lot of people without SQL backgrounds.
Description of Paper
The paper will include an outline of and an introduction to Natural Language Processing (NLP). I will base my final paper significantly on my survey paper. Therefore it will contain sections on aspects of NLP, such as Natural Language Understanding, Knowledge Bases, Information Extraction and part-of-speech tagging. However, the primary focus of the paper will be on comparing the techniques discussed in my survey paper.
Description of Software
The application will consist of the following components:
ABSTRACT
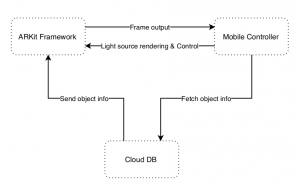
As for today, augmented reality technologies are shifting towards small devices with a focus on user interaction. As more techniques in rendering AR objects are developed, more computing powers are needed to keep up. Mobile AR technology has all functions built in, in addition to GPS and compass for realistic AR rendering technology. However, mobile devices lack storage and the raw power for 3D rendering of complex objects. The paper discusses the possibility of integrating cloud to fix these problems, and conclude that using cloud for performance is difficult while using cloud for storage is possible. Results show that performance drop when utilizing cloud storage for 3D objects are minimal. As for now, cloud fetched objects are rendered without textures, leading to a reduce in realism compared to local fetched objects. Thus, the next step of the pro ject is implementing textures fetch from cloud DB on top of the 3D object file fetch.
Abstract
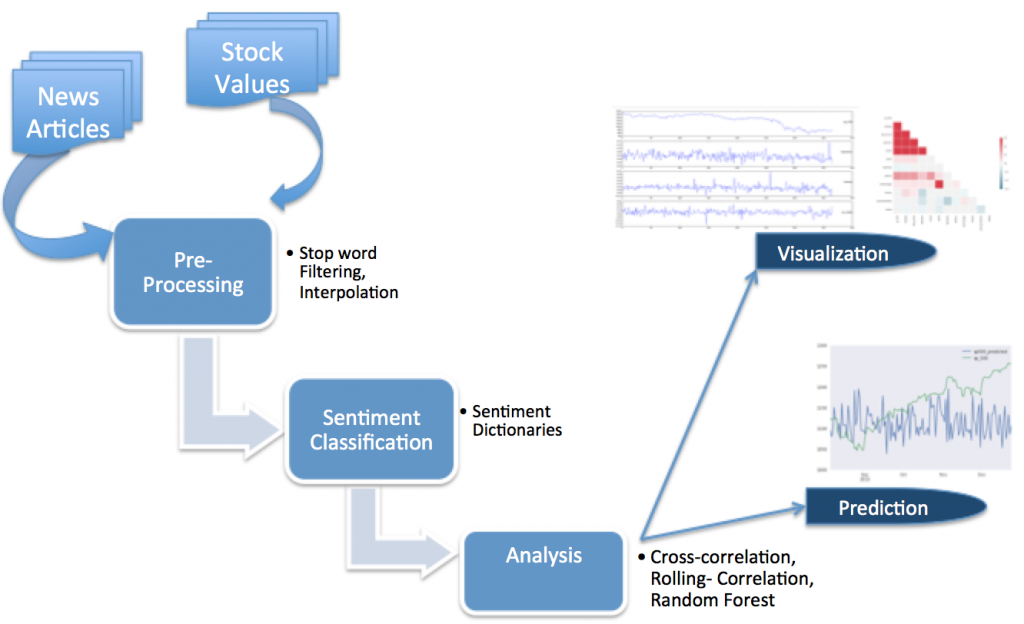
For decades people have tried to predict the stock markets. Some have used historical price trends to predict future changes, while others rely on their gut feeling to make predictions. The prices of stocks reflect the overall confidence the market has on the stocks. The level of this confidence, according to the behavioral economics, is a collective of society’s emotions towards a particular stock, which to some extent influences their decision-making. However, is there a way to know the collective mood of society towards a stock? Can this mood be extracted from newspaper articles and magazines? To address this question, I turn to the field of Natural Language Processing. With the help of various sentiment dictionaries, I ran various types of sentiment analysis over 1.7million newspaper articles published in The Guardian between 2000 and 2016. I then chart the changing sentiments over a time period against the various stock market indices to see whether or not news sentiment is predictive of economic indicators such as stock prices.
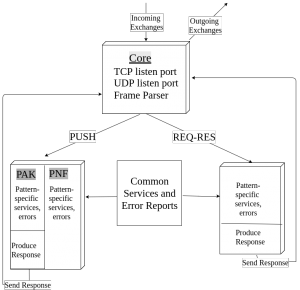
Software Architecture :
Links:
ABSTRACT
There has been a lot of attempts in building predictive models that
can correctly predict the stock price. However, most of these models
only focus on different in-market factors such as the prices of other
similar stocks. This paper discusses the efficiency/accuracy
of three different neural network models (feedforward, recurrent,
and convolutional) in predicting stock prices based on external
dependencies such as oil price, weather indexes, etc.
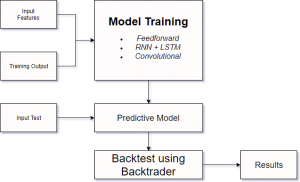
Software architecture
Links:

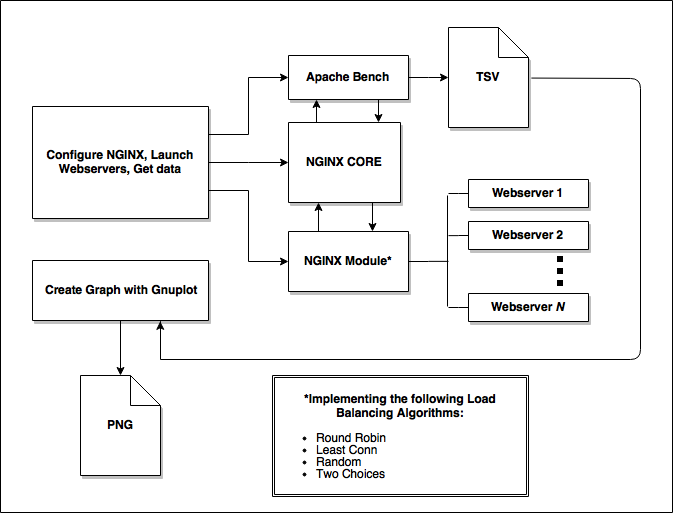
Load balancing remains an important area of study in computer science largely due to the increasing demand on data centers and webservers. However, it is rare to see improvements in load balancing algorithms implemented outside of expensive specialized hardware. This research project is an attempt to bring these innovative techniques to NGINX, the industry leading open source load balancer and webserver. In addition to implementing a new, native NGINX module, I have developed a simple workflow to benchmark and compare the performance of available load balancing algorithms in any given production environment. My benchmarks indicate that it is possible to take advantage of more sophisticated load distribution techniques without paying a significant performance cost in additional overhead.
My full survey paper can be found using the following link. Please keep in mind that there has been some changes to it since CS388 ended. The changes would be reflected in the actual paper.
Capstone_Project_Proposal_Nirdesh
SurveryPaper_SeniorCapstone_Final_Nirdesh
My Senior Project will be based on improving the accuracy of machine learning algorithms by using various statistical methods to correctly pre-process a dataset and then feed it into a machine learning algorithm.
The software part of my project will be based on designing a platform that works with R studio to run these tests on a dataset and then feed it to a machine learning algorithm and then analyze the results. This software recommends the series of ‘knobs’ that can turned on the dataset to better it for the algorithm. My paper will be based on the results that I found and whether or not pre-processing made a difference in the performance of these algorithms.
Steadily working on the prose of the survey paper. Got the feedback from Charlie and incorporating those. No major changes yet. Reading some of the failed cases of p2p/mesh mobile/wireless implementation to understand and find problems with appropriate scope.
I’m looking into different implementation of peer to peer technologies and trying to understand what and where they lack in comparison to traditional implementation. Reading about firebase API as well, which powers app like firechat.
Topic 1 : Data Mining Analysis and Prediction
Week 1: March 12- 18
Went into more detail on the annotated bibliographies, organized the order in which would will help my paper and best fit the flow of ideas.
Week 2: March 19 – 25
Looked into what the data mining tools and application that are mentioned in the papers. Checked if they could fall within the scope of the work that I want to do. Created the overall outline for my paper including how the major topics and methodology would progress. Created the workflow diagram and looked at other previously done Survey paper. Latex seems like a good tool to use in addition to Zotero to create templates.
Watched some TED talk videos on the topic:
Week 3: March 26 – 31
Started connecting major topics in terms of how they fit the block structures for my paper and compiled paragraphs on some topics. Looked into other previously done works mentioned in the papers regarding Data Mining and the tools used in those research.
Week 4: April 1- 7
Building on the outline and creating diagrams mentioned. Mostly going through papers to build on the brief few sentences mentioned for each topic.
Week 5: April 7 – 14
Worked on the second draft. Added more content to the paper, removed a couple of subtopic.
Week 6: April 14 -21
Finished up the survey paper with all necessary topics and figures and diagrams as well as the conclusion.
Week 1 March 30th
I have gone ahead and read more carefully about the chosen topic from my bibliography. Furthermore, I’m looking for some more papers to add to the bibliography list. I also have the general outline for the survey paper ready, and waiting to add more details.
Week 2 April 6th
Week 3 April 12th
Week 4 April 19th
Week 5 April 26th
Week 1 (3/29):
Week 2 (4/5):
Week 3 (4/12):
Week 4 (4/19):
Week 5 (4/26):
M. Sharif, K. Ayub, D. Sattar, M. Raza
Real Time Face Detection method by changing the RGB color space to HSB color space and try to detect the skin region. Then, try to detect the eye of the face in the region. The first step is face detection, second step is face verification. Time is crucial since it is real time. The published time is 2012.
http://sujo.usindh.edu.pk/index.php/SURJ/article/view/1553
https://www.researchgate.net/publication/257022696_Real_Time_Face_Detection
https://arxiv.org/abs/1503.03832
A paper describing the method for face recognition using FaceNet system. FaceNet is a system by Google that allows high accuracy and speed in face detection mechanism. The accuracy of FaceNet system is 99.63% on the widely used Labeled Faces in the Wild (LFW) dataset.
Two Implementations of FaceNet for Face Recognition:
https://github.com/cmusatyalab/openface
https://github.com/davidsandberg/facenet
Develop a framework for implementing augmented reality interface on hand-held devices. There’s a graphical tool for developing graphical interfaces called PocketKnife, a software renderer called Klimt and a wrapper library that provides access to network sockets, threads and shared memory. In the end, they develop several AR games with the framework, such as the invisible train game.
Using support vector machine and compare the results with other methods of forecasting. The upper bound C and the gamma kernel parameter play an important role in the performance of SVMs. The prediction performance may be increased if the optimum parameters of SVM are selected.
C parameter is the parameter for how small will the hyperplane of largest minimum margin be.
T1- Data Mining, analysis and prediction
Topp, N., & Pawloski, B. (2002). Online Data Collection. Journal of Science Education and Technology, 11(2), 173-178.
This paper touches on the history online data collection, some brief review of the more recent progress and work that is being done as well as how a database connected to the Internet collects data. It also presents a brief insight into where these methods might head towards in the future. Overall, this is a short 7-page article to give a good insight and a starting point as well good references.
Hand, D., Blunt, G., Kelly, M., & Adams, N. (2000). Data Mining for Fun and Profit. Statistical Science, 15(2), 111-126.
This is a more detailed paper regarding the different tool, models, patterns and quality of data mining. Even though it was written in 2000 is very useful is terms of getting a broader idea of model building and pattern detection. It looks at statistical tools and their implementation as well as the challenges to data mining through well explained examples and graphs.
Edelman, B. (2012). Using Internet Data for Economic Research. The Journal of Economic Perspectives, 26(2), 189-206.
Economist have always been keen to collect and analyze data for their research and experimentation. This paper introduces how data scraping has been employed by companies and businesses to extract data for their use. It is an excellent paper that combines data scraping with data analysis and where and how it has been used. It sets the foundation for data analysis and lists various other good papers in the particular field.
Buhrmester, M., Kwang, T., & Gosling, S. (2011). Amazon’s Mechanical Turk: A New Source of Inexpensive, Yet High-Quality, Data? Perspectives on Psychological Science, 6(1), 3-5.
Amazon’s Mechanical Turk helps bring together a statistician’s dream of data collection and an economist’s love for data analysis. It has proved to be an excellent platform to conduct research in not only economics but also psychology and other social sciences. This is a very short 4 page paper that looks at the mechanical Turk, what it has helped research and conclude and how it has been used to obtain high quality inexpensive data. This paper is significant in a sense that it is an application of the above-mentioned tools of collection, analysis and possibly prediction.
T2- A more informed Earlham : Interactive Technology for Social change
1/ Vellido Alcacena, Alfredo et al. “Seeing Is Believing: The Importance of Visualization in Real-World Machine Learning Applications.” N.p., 2011. 219–226. upcommons.upc.edu. Web. 20 Feb. 2017.
2/ “And What Do I Do Now? Using Data Visualization for Social Change.” Center for Artistic Activism. N.p., 23 Jan. 2016. Web. 20 Feb. 2017.
3/ Valkanova, Nina et al. “Reveal-It!: The Impact of a Social Visualization Projection on Public Awareness and Discourse.” Proceedings of the SIGCHI Conference on Human Factors in Computing Systems. New York, NY, USA: ACM, 2013. 3461–3470. ACM Digital Library. Web. 20 Feb. 2017. CHI ’13.
T3– CS for all : Learning made easy.
1/ Muller, Catherine L., and Chris Kidd. “Debugging Geographers: Teaching Programming To Non-Computer Scientists.” Journal Of Geography In Higher Education 38.2 (2014): 175-192. Academic Search Premier. Web. 20 Feb. 2017
2/ Rowe, Glenn, and Gareth Thorburn. “VINCE–An On-Line Tutorial Tool For Teaching Introductory Programming.” British Journal Of Educational Technology 31.4 (2000): 359. Academic Search Premier. Web. 20 Feb. 2017.
3/ Cavus, Nadire. “Assessing The Success Rate Of Students Using A Learning Management System Together With A Collaborative Tool In Web-Based Teaching Of Programming Languages.” Journal Of Educational Computing Research 36.3 (2007): 301-321. Professional Development Collection. Web. 20 Feb. 2017.
T1– ::Data Mining, analysis and prediction
This survey paper will first look at the tools used to gather and store data from user and other domains. It will then look at how, in the past, others have worked with data to make co-relations and predictions. It will then look attempt to look at publicly available data and try to find correlation with other market data. Our focus here will be to see the extent to which one data can be abstractly analyzed and linked to others and with what degree of certainty. It will involve working with a lot of data and analyzing it to find trends and patterns and possibly making predictions.
Topic 2 – CS for Social Change and Sustainability
Every year the different branches of campus such as Health Services, facilities, Public Safety, ITS and the registrar’s office send out emails to students that are lengthy reports which no one ever reads. Earlham facilities keep records on energy consumption that the students seldom look at and every now and then there are issues around campus that divides the student body but students rarely get to vote on.
To address these problems I suggest a mobile survey app that allows students to vote on issues as well as view various data from departments around the campus. These survey results and data will also be dynamically displayed on screens around the campus. It would involve learning and implementing graphic interface tools as well as visualization programs. If we link this through quadratics (as is done for student government voting), we can make sure that only Earlham students get to vote and each student gets to vote only once.
The ability to view data and trends on key statistics across from these departments would certainly help the students in a better-informed position and in a place to bring change.
T3 – CS for all
As I see my Econ professors struggle with STATA (a simple tool to work with data through commands), I cannot help but draw parallels on how it first felt to learn programming. Reality is that most people without a CS background have difficulty in learning these new tools and softwares. Softwares, most of which are outdated in their use, but, are still taught to students who usually resort to memorizing them to pass midterms. I think that it would be very helpful if we as CS students can help discover, learn, teach as well as document these softwares and help other departments. I propose an interactive interface like Code-academy where students are given tutorials that go progressively forward in complexity. Co-ordination from these departments would be essential to understand their needs and create an interface catered to help their students learn from scratch.
{ possible additions could be log-in mechanism via moodle to ensure students are spending the amount of time they should be taking these interactive courses”}
Abstract 1
Recently I became interested in P2P messaging and/or protocols. While these protocols can offer security and prevent wiretapping (for example, bitmessaging), there are some serious drawbacks. For one, decentralization is difficult to achieve while maintaining the advantages of a centralized server, which provides major shares of benefits of client-server model. Even if decentralization is achieved, the architectures turns out to be not so well for scalability. I haven’t identified what exactly I am going to work on, but focusing on an aspect that makes the P2P protocols more robust is my motivation behind the project.
Abstract 2
It’s a widespread belief that fake news has played a noteworthy roles in shaping the voters pick for the US presidential candidate in the election cycle 2016. Fact checking, and thus weeding out fake news is one of the most difficult challenges that technology can take on; however, it’s unlikely for a set of algorithm to match the accuracy of a human fact checker, as of today. In this paper, we examine how natural language processing can help finding patterns in dubious claim as opposed to stories that are factually consistent. Employing artificial intelligence agent, we are able to show that a “true story” is supported by several sources and report the same event/fact, while a fake news story is likely reported from a single source and gets circulated. In addition to that, we’ll also examine how AI can be used to detect the extent to which a story is verifiable, which is a key characteristic of a credible story.
Abstract 3
When a device is connected to the internet, a combination of several data points uniquely identify a machine, which is known as browser fingerprinting. Advertisers and marketers use cookies in order to target potential customers, and it is very easy to abuse those tools and it leaves any device connected to the internet vulnerable to attacks. We’ll investigate the uniqueness of browser fingerprinting briefly and examine the impact of a single data point in determining the uniqueness of a fingerprint. In doing so, we’ll analyse the privacy aspect of an user and ways to achieve the security, anonymity and how the anonymity impacts the connectivity of a device.
IDEAS:
T1 – One data predicts another
This survey paper will look at publicly available data and try to find correlation with other market data. For example, it would study how weather patterns or viral news stories could correlate to stock prices for certain stocks. It will try to see to what extent one data can be abstractly analyzed and linked to others with what degree of certainty. It will involve working with a lot of data and analyzing it to find trends and patterns.
Possible Ideas to build on:
— > Will be looking into Behavioral economics and how certain events follow another. Using this, I will look for places to extract co-related data.
— > Will involve a fair bit of learning STATA to work on data and derive co-relations. Some statistical modeling would be helpful.
—> Stock market data is usually well kept however similar day to day data is rarely seen in other places. One possible topic being finding co-relations is to look in unusual places within the stock markets. for example: Boeings stocks might be brought down by President Trump’s tweets but what other markets have shown unusual reactions to his tweets. Perhaps a comparison of market changes with key words in tweets of with the most popular people on twitter on that area.
/———————————————————————————————————————————-/
T2- Computers, data and everything else.
This survey paper will look at how the trends and tools of data analysis have changed within the stock markets and particularly with the field of Economics. Infamously labelled “the dismal science”, economist are only now able to collect and manipulate data to prove their theories. It will look at how data analysis because of modern computing is affecting other fields.
Possible Ideas to build on:
—> Databases used in the stock markets and how they have eased day to day operations.
—> Other popular mass scale data collection tools and how development in computing has changed their workings. { This would be more of a history digging up, I would look up how and why the successors were picked over their predecessors.}}
—> Some bits of this project could be used on the first idea.
/——————————————-]———————————————————————————-/
T3 – Data Mining
This survey paper looks at how and what data is being extracted from users and in what ways companies are storing and profiting from it. It looks at targeted advertisements, cyber security, the algorithms working in the background and the databases that sell our data.
Possible Ideas to build on:
—> Look into tools of data mining. The use of cookies and pop up ads and data extraction from search bars. How are these companies getting smarter every day, what loopholes in are they employing. How they create a virtual personal of you based on what they know about you so far.
—> Learn how the government has in the past used data from social security and taxes to analyze various sociological aspects. Where else has such data analysis existed within the computer science. How can the two be related ?
/——————————————————————————————————————————-/
I/ Sometimes lectures and text books can be too “dry” for students to get excited about a subject, specifically economics. At the same time, researchers have found the potential of games in education, especially when used as an introduction to new concepts. EconBuild is a game that simulates different aspects of economics that we normally encounter in our economics intro classes, proving students a platform to practice what they learn in class. The game can help students to enforce the most fundamental elements of economics such as demand and supply, stock market, etc.
II/ In this day and age, more and more businesses choose to expand their brand using social networks, thus leading to the fact that social media users continue to provide advertisement, positive and negative. In order to become competitive, it is necessary for a company to establish its online present as well as analyze its component’s dominance. Using a Hadoop based approach to reduce the size of database, we can gather and analyze information about a company on social media and predict certain trends to help with its growth.
III/ Stock market is usually unpredictable. There is no particular rule that it obeys to, which is why investing in stock is considered a risky business. Many people have tried to analyze particular trends in order to guess whether the stock price would rise or not. However there hasn’t been a lot of software that analyze the relationship between different related stocks. Using support vector machine approach, combining with graph similarity scoring and matching algorithm, we can establish relationships between different stocks, thus open the possibility of being able to predict particular stock trends.
This paper will describe a project created using support vector machines (SVM) to predict stock price. Since the method is support vector machines, the data must be labeled, which fits what needed for stock evaluation. Stock’s information comes from its financial statements, which are all labeled. In this particular project, the version of SVM is a machine called least square support vector machines, which are used for regression analysis. The language being used is Python with scikit-learn, which has SVM implemented in the library.
This paper will describe a project using augmented reality (AR). AR is a live direct or indirect view of a physical, real world environment augmented (or supplemented) by computer-generated sensory input such as sound, video, graphics or GPS data. For this particular project, I will use Swift to implement a iOS app to provide users a augmented reality graphical view with supplemented GPS information. The application will take the user’s location and give additional information about the POI around the areas on the phone when the POI shows up.
This paper will describe a project using Machine Learning for Real-time Face Detection and Recognition using the mobile’s camera and compare the result to college’s student database. The paper will allow people to connect easily by knowing the name, location and mobile number with just a look on the phone. The program will run on iOS and Android using Cordova as a base.
Hello World
Hello world
“hello work”
This means that I have my WordPress page up and running. I will be posting updates on this site on my Senior Capstone project. That also made me suddenly realize my college career has begun its ending! whoops.